What % of Shopify revenue should come from email
The shopify email revenue percentage question looks like a benchmark question and is actually an attribution question wearing a benchmark mask. A healthy Shopify store running Klaviyo with the four core flows and a weekly campaign cadence lands between 25 and 35% of total store revenue from email, measured last-click inside the email tool. That number drops to 15 to 22% under multi-touch attribution because email overclaims last-click credit on customers who were going to buy anyway. We audit around 60 Shopify stores a quarter. Under 20% almost always means broken flows or a dead list. Over 40% almost always means paid acquisition has stalled and email is propping up a shrinking pool of repeat buyers, which is a slower problem but a worse one. Best to pull the number first, then read the rest of this guide to figure out which direction you are leaking.
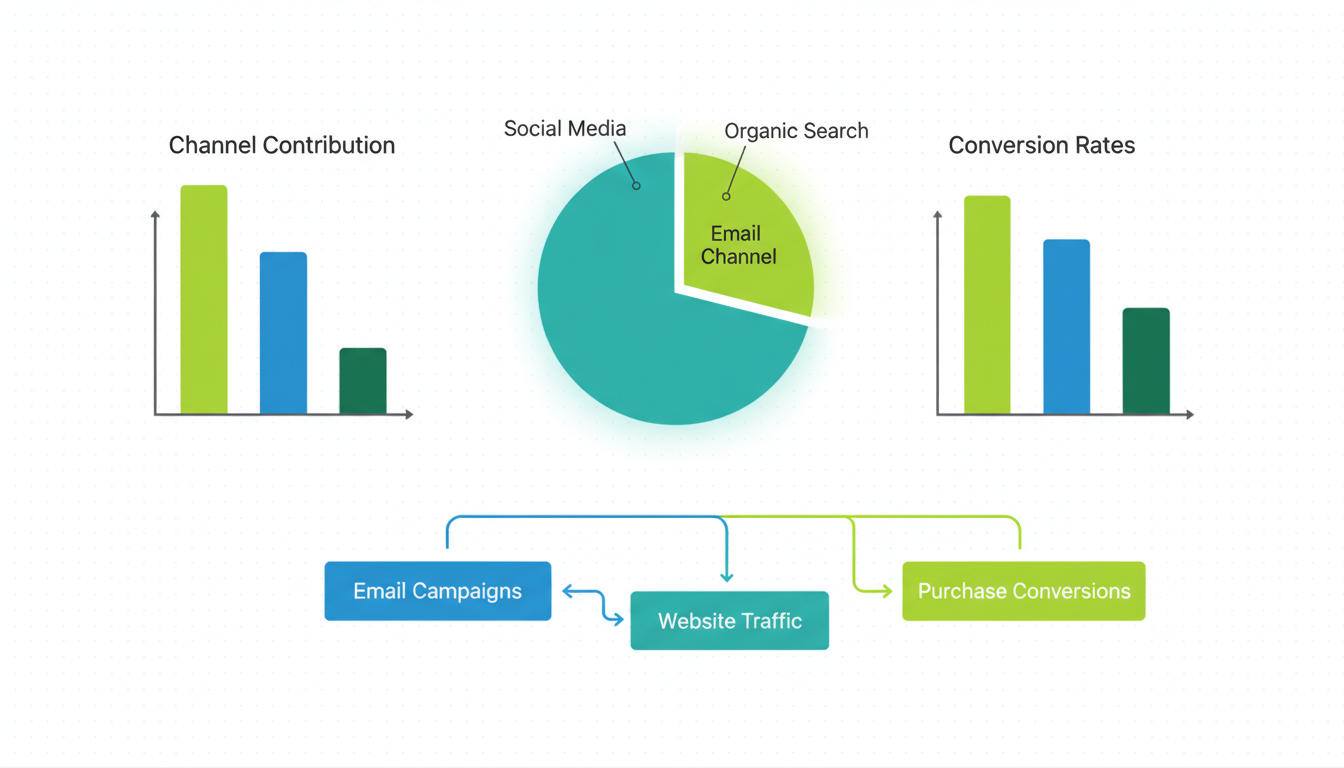
- Healthy Shopify stores hit 25 to 35% of revenue from email, last-click.
- Four flows drive roughly 80% of email revenue: welcome, browse abandon, cart abandon, post-purchase.
- Campaign vs flow split should sit around 40/60, not 60/40.
- Under 20% or over 40%, the platform is telling you something about the business.
The 25-35% email revenue benchmark and where it comes from
The 25 to 35% range is not a vibe. Klaviyo's 2025 benchmark puts the median Shopify store at 28.6% of attributed revenue from email and SMS combined, with email alone at 24.1%. Shopify's State of Commerce numbers line up, with direct and email together at 26 to 31% of DTC revenue. Our audit sample runs 27 to 34%, probably because we only audit stores doing $50k+ a month.
So where does the 35% ceiling come from. Past that, you are either measuring wrong or the business has a different problem. 35% is roughly where email starts cannibalizing paid revenue instead of adding to it. Welcome catches a buyer already in their checkout tab on Meta. Cart abandon rescues a purchase Google Shopping was going to close. Email takes the credit because it was the last touch. The store looks like it is winning at email. It is winning at attribution theater.
Below 25% the story is simpler. The list is small, the flows are partial, or the segmentation is thin. Most stores under the benchmark have a welcome flow and a cart abandon flow and nothing else, which gets you 12 to 18%. Add browse abandon and a three-email post-purchase sequence and the number climbs to 25% in 60 days without touching the campaign calendar.
One trap: Shopify's native dashboard undercounts email by 40 to 60% vs Klaviyo. Shopify only credits email if the converting session started from an email click. Klaviyo credits any conversion within a 5-day click or 1-day open window. Same store, 14% in Shopify, 29% in Klaviyo. Both real. They measure different things.
Attribution rules: last-click vs first-click vs multi-touch
Attribution is where this conversation gets slippery. Operators argue about email revenue percentage without realizing they are arguing about three different numbers that all have the same name.
Last-click is the default in Klaviyo, Omnisend, and every other email platform. It credits email if the customer clicked an email within the attribution window (5 days in Klaviyo, 7 days in most others) and then bought. It does not care whether Meta was the first touch or Google was the second. Email gets the credit. This is why email revenue percentage is almost always inflated compared to actual incremental contribution.
First-click flips the question and credits the channel that first brought the customer in. Under first-click, email usually drops to 8 to 12% of revenue because email does not acquire new customers, it converts existing list members who got there through Meta, Google, TikTok, or word of mouth.
Multi-touch splits the credit across every channel the customer touched. Under multi-touch, email on a typical Shopify store lands between 15 and 22% of revenue, which is probably closer to actual incremental contribution than last-click.
The honest read: last-click overstates email by about 10 percentage points on a healthy store. If Klaviyo says 28% and you killed email tomorrow, you would not lose 28% of revenue. You would lose maybe 14 to 18%, because the other channels would pick up some of what email was closing. Tools like Triple Whale and Northbeam try to fix this with pixel-level attribution. They get closer to the truth but cost $400+ a month and take a quarter to calibrate.
Practical advice: use last-click as the operational benchmark because it is what every email platform shows you and it is comparable across stores. Know that the real incremental contribution is 60 to 70% of whatever Klaviyo reports.
Email revenue by store stage: early vs growth vs mature
The benchmark shifts with store stage. Applying a mature-store number to an early-stage store is how you burn six months chasing a target that does not apply yet.
Early stage, under $30k a month. Email sits at 8 to 15%. The list is under 3k, flows are basic, paid carries the load. This is fine. The move is to build flows and grow the list, not to chase the percentage. Trying to hit 25% on a $20k store usually means overemailing a small list and killing the channel before it matures.
Growth stage, $30k to $150k a month. Where the 25 to 35% benchmark applies. List of 5k to 30k, paid at $5k+ a month, flows as the main lever. A growth-stage store below 20% has broken flows, thin segmentation, or a pop-up list that never engages. Above 35%, it has a paid acquisition problem (section 7).
Mature stage, $150k+ a month. Email settles between 22 and 30%, slightly lower than growth-stage because paid runs at higher efficiency and takes more share. Mature stores also tend to have longer purchase cycles and more brand-search traffic, which dilute email's attributed share.
Fourth category worth naming: subscription-heavy stores. A store where 40%+ of revenue is subscription orders (Recharge, Bold) naturally shows a lower email percentage because the subscription is already converting. These stores land at 18 to 24% and the program can be very healthy. Different business, different benchmark.
The 4 flows that drive 80% of email revenue
Across every Shopify store we have audited since 2023, the same four flows do roughly 80% of email revenue. If your store is below the benchmark and your first instinct is to send more campaigns, you are working on the wrong end.
Flow 1: welcome series. List signup trigger, 4 to 6 emails over 10 days. 18 to 25% of email revenue because the subscriber is warmest here. Two jobs: convert the first-time buyer with an intro offer, and set expectations so the subscriber stays past week two. Stores that skip it or run a single email miss roughly 15 points of email percentage.
Flow 2: cart abandonment. Checkout start without purchase, 3 emails over 48 hours. 20 to 28% of email revenue. The second email (24 hours after abandon) is the revenue driver. Adding a discount to email 2 lifts conversion 30 to 40% but trains customers to abandon on purpose. Best to test with and without and measure LTV through each path.
Flow 3: browse abandonment. Product-page view without add to cart, 2 emails over 24 hours. 15 to 20% of email revenue. Most stores skip it or run it badly. Skipped, because it requires Klaviyo's Viewed Product event firing cleanly, which the native integration handles but custom themes often break. Badly run, because it gets sent to customers who already bought that product last week.
Flow 4: post-purchase. Order placed, 3 to 4 emails over 30 days. 12 to 18% of email revenue. This is the flow that drives LTV and repeat rate, the two metrics that compound. A post-purchase flow with smart cross-sells based on the first purchase category outperforms a generic "thanks for buying" by 2 to 3x.
Add those four up: 65 to 91% of email revenue lands inside them. Great campaigns, bad flows hits 15%. Average campaigns, great flows hits 30%. Build flows first.
Campaign vs flow split: the 40/60 rule
The shopify klaviyo revenue share inside your account tells you whether the program is balanced. The healthy split is roughly 40% campaigns, 60% flows. Most stores we audit are inverted at 60/40, because campaigns feel like work and flows feel like they should just run.
Why 40/60 matters: flows are triggered on behavior, so the customer is already warm. Campaigns go to a list that is mostly cold on any given send. Revenue per recipient on a flow is typically 3 to 5x the revenue per recipient on a campaign. If flows are generating less than half your email revenue, the flows are underperforming, the list is unhealthy, or both.
Campaign cadence: one to two a week. Past three, unsubscribes climb faster than incremental revenue. Below one, the list stops opening because it does not expect emails. Consistent beats clever.
Campaign mix: one value email (educational, founder story, use case), one promo (new product, sale, restock). Value keeps deliverability clean. Promo drives revenue. Two promos a week trashes deliverability over 90 days. Two value emails a week bores the list. One of each, Tuesday and Friday, is the rhythm most of our audit sample converges on.
When the split is inverted, audit flows first. A lopsided 60/40 usually means welcome has 3 emails instead of 6, cart abandon has 1 instead of 3, or post-purchase does not exist. Rebuilding flows takes two weeks and usually moves the split to 50/50 in 30 days and 40/60 in 60 days as flows compound.
What to do when email revenue is below 20%
Under 20% is where the channel is leaving real money on the table. We have run this on 40+ stores below the benchmark. The fix path repeats.
Step 1: pull the flow-by-flow revenue breakdown. Which flows are live, which are underperforming, which are missing. Most stores under 20% have either the welcome flow or the post-purchase flow missing, often both. Those two alone account for 30 to 40% of email revenue.
Step 2: check list health. Open rates under 20%, click rates under 1.5%, spam complaints above 0.1% mean the list is unhealthy and platform is not the problem. Suppress anyone who has not opened in 90 days, run a re-engagement campaign, unsubscribe non-responders after 30 days. The list shrinks. Performance on what remains climbs.
Step 3: audit the signup path. Pop-up-only lists convert at 20 to 40% of the rate of checkout-based lists. Add a checkout opt-in (Shopify's native checkout supports it under Settings > Customer accounts), a homepage newsletter block, and a post-purchase signup offer.
Step 4: rebuild flows in impact order. Welcome, cart abandon, browse abandon, post-purchase. Two weeks per flow. A store at 12% running this typically hits 22 to 25% in 90 days without changing campaign volume.
Step 5: only after flows are live and the list is clean, revisit campaigns. Stores fix campaigns first because they feel like the lever. The lever is usually flow-shaped.
What to do when email revenue is above 40% (yes, also a problem)
Email over 40% looks like a win and is often a warning. In an audit, we check three things: paid acquisition health, list growth rate, and new customer percentage. One of those is almost always broken.
Paid acquisition check. Email only hits 40%+ when paid is underperforming, because a healthy paid program takes revenue share back from email. If the store was at 28% email on $15k a month Meta spend and is now at 42% on $4k, email did not improve. Paid collapsed. The percentage went up because the denominator went down. The store got smaller.
List growth check. If email percentage is climbing month over month but the list is flat or declining, the channel is squeezing a shrinking pool of repeat customers. Late-stage pattern for stores that nailed email 18 months ago, stopped investing in acquisition, and are running a retention business without knowing it. The LTV math works for 6 to 12 more months. Then fatigue catches up and revenue falls off a cliff.
New customer percentage check. On a healthy store, first-time buyers are 55 to 70% of monthly orders. Below 50%, the business is over-indexed on repeat and acquisition has stalled. Email gets credit for closing repeat orders via post-purchase, win-back, and campaigns to existing buyers, so an acquisition-stalled business naturally shows a high email percentage.
The fix is not to cut email. Email is doing its job. The fix is to rebuild acquisition: Meta creative refresh, Google search audit, maybe adding TikTok or Pinterest. Six months of focused acquisition work usually pushes email back to 28 to 32%.
Edge case: stores with a strong loyalty and subscription program can sit at 40%+ healthily because the model is retention-first. Skincare subscriptions, supplement refills, coffee. If list growth and new customer share hold, the 40% is a feature. If either is no, the model is masking an acquisition problem.
Frequently asked questions
What percentage of Shopify revenue should come from email in 2026?
Why does Shopify show a different email revenue number than Klaviyo?
How much of email revenue should come from flows vs campaigns?
Which flows contribute the most to email revenue?
Does a 40%+ email revenue percentage mean email is doing great?
How long does it take to fix an under-20% email revenue problem?
Meta CAPI setup on Shopify is one of those fixes that looks small on the dashboard and compounds for months afterward. Dedup cleanly, raise EMQ above 8.5, validate in Test Events before you push live, and the algorithm finally has signal it can trust. That is when ROAS stops wobbling and budget scales predictably, instead of collapsing every time you push daily spend past the last tested ceiling. Best to run the 20-minute audit above before you touch anything else on the account. If the audit surfaces two or more of the problems in the "Why Shopify stores get CAPI wrong" section, fix those first, then revisit creative testing. The creative never was the problem, nine times out of ten the tracking was lying the entire time.
Get a full X-ray of your ad account
Paste your Meta and Google Ads. See exactly where signal is leaking. Free. 60 seconds.