How to calculate and raise LTV on Shopify
Shopify LTV calculation is the math most operators either skip or run wrong, and the wrong number quietly rots every acquisition decision downstream. LTV drives the CAC ceiling, the paid channel mix, the retention budget, and whether the store is actually growing or just printing top-line revenue at a loss. Across our 471-store sample, the spread between stores using a predicted-LTV formula and stores using an observed-cohort formula is about 40%, and almost always in the direction that flatters the number. The 90-day LTV tells you if acquisition is working. The 1-year LTV tells you if retention is working. The lifetime LTV tells you if the category can ever be profitable. Best to compute all three, match them against the 3:1 LTV:CAC floor, and stop using a single blended number pulled from a dashboard nobody audited. The wrong LTV sends operators chasing paid spend when retention was the binding constraint.
- LTV has three useful formulas. Predicted is the worst of them and the most common.
- 90-day, 1-year, and lifetime LTV answer different questions. Confusing them breaks CAC math.
- Five levers raise LTV. Repurchase rate does more than AOV, and subscription does more than both.
- LTV:CAC of 3:1 is the floor. Below 2:1 the business is burning equity on every new customer.
What LTV actually is and what it is not
Customer lifetime value Shopify gets quoted casually, usually as a single number, usually without any definition of which LTV. LTV is the total gross revenue (or gross profit, depending on definition) a customer generates across the full relationship with the store. The number almost every Shopify store actually reports is either the 12-month cohort LTV (revenue per first-purchase cohort over 365 days) or a predicted LTV from a third-party app that fits a curve to 60 days of data and projects the next 5 years. These are not the same metric. The predicted number runs 30 to 50% higher than the observed number on most stores we audit, and it is the number operators quote in board meetings.
The short version: LTV is an observed quantity when measured and a guess when predicted. The observed version (cohort LTV from Shopify Analytics) is the one that matters for decisions. Predicted LTV is useful for forecasting but not for ceiling-setting on CAC, because the prediction always flatters the store. Shopify's customer cohort report surfaces the observed number directly. The Klaviyo benchmark report publishes LTV curves by industry that are useful as a sanity check against your own cohort data.
What LTV does not measure: margin, returns, support cost, or any of the other non-revenue things that turn a $200 LTV customer into a $60 contribution-margin customer. Plug gross-margin-adjusted LTV into the CAC ceiling formula, not top-line LTV. The gap is usually 30 to 60%, which is the entire headroom on acquisition spend.
The 3 LTV formulas that are actually useful
LTV Shopify formula options split into three categories, and the one you pick changes the number by 30 to 50%. Most blog posts quote a single formula (the predicted one, usually) without explaining that the other two answer different questions and produce different numbers. Here are the three that actually work.
Formula 1: Cohort LTV (observed). Group customers by their first-purchase month. Sum all revenue from that cohort over the next N days. Divide by cohort size. This is the honest number. It is backward-looking, which is the whole point. Shopify's customer cohort report produces it natively. Nothing to install, nothing to predict.
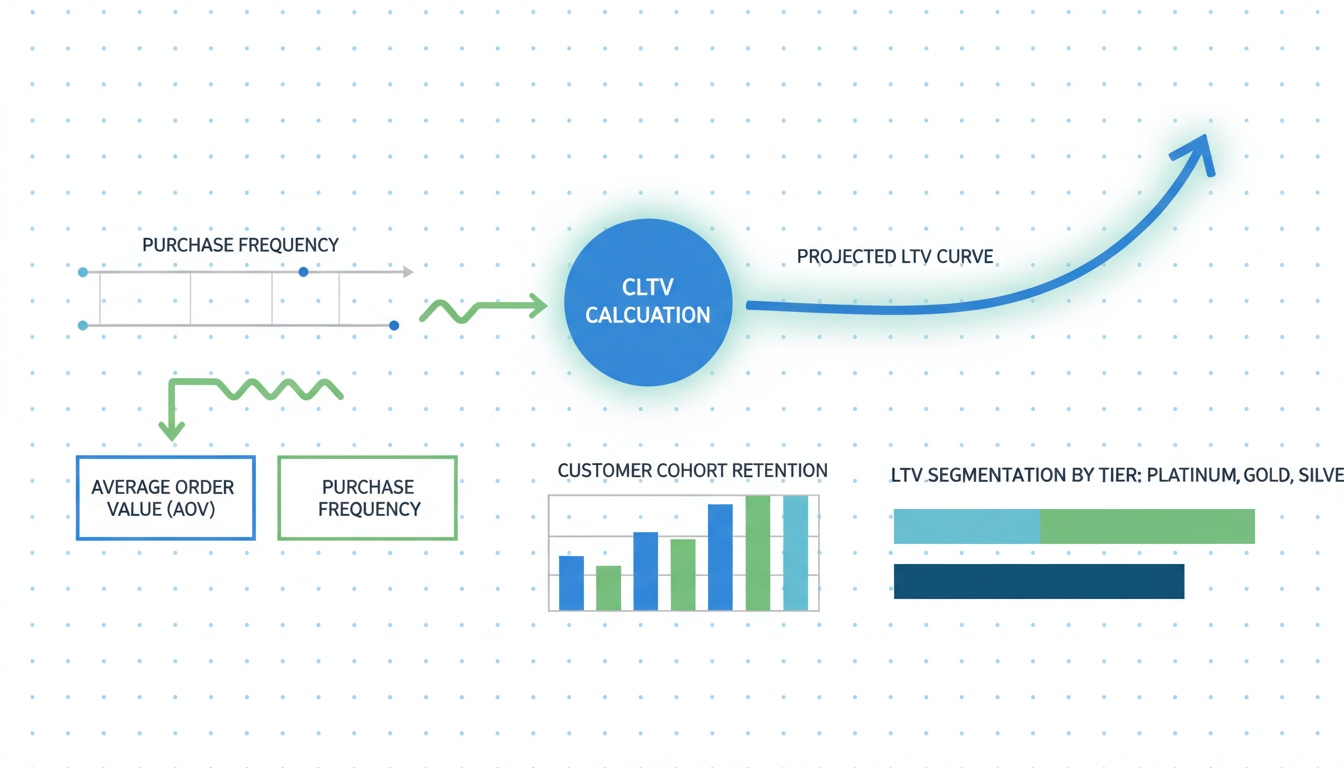
Formula 2: AOV times orders-per-customer. AOV is average order value. Orders-per-customer is the total order count across the full relationship. A $60 AOV store with 2.4 average orders per customer has an LTV of $144. Useful for stores younger than 12 months where cohort data is thin. Undersells LTV for subscription-heavy stores, oversells it for one-time-purchase categories.
Formula 3: Gross margin times retention curve. The one finance teams use because it reconciles to the P&L. Take 12-month cohort LTV, multiply by gross margin, apply the observed retention curve (usually 60 to 70% churn after order 2, another 50% of the remaining churn after order 3). The output is contribution-margin LTV, which is the number that belongs in the CAC ceiling calculation.
The wrong formula most blog posts push is the fourth one: predicted LTV from an app that fits a curve to 60 days of data. Predicted LTV always runs higher than observed because the curve-fit exaggerates the tail. Use observed LTV for decisions, predicted LTV for forecasting, know the difference.
90-day, 1-year, and lifetime windows: when each matters
The window you measure LTV against changes which question you can answer with the number. Operators pick one window (usually 365 days because it is the default in Shopify Analytics) and use it for everything, which breaks the diagnostic value.
90-day LTV. Tells you if acquisition is working. A cohort at $85 revenue per customer in 90 days against a $45 CAC is healthy. The same cohort at $55 is not. This is the metric that should gate paid spend because it answers "is the customer we just bought going to pay us back in 90 days?" For most categories, 90-day LTV should cover CAC plus first-purchase gross margin plus a contribution to second purchase.
1-year LTV. Tells you if retention is working. The gap between 90-day and 365-day is the retention window. If 90-day is $85 and 365-day is $110, the retention engine is adding $25 per customer over 9 months, which is weak. A healthy curve roughly doubles 90-day LTV by day 365 in subscription-friendly categories (beauty, supplements, food) and adds 30 to 50% in one-time-purchase categories (apparel, home goods). This is the number that should drive retention budget decisions.
Lifetime LTV. Tells you if the category can ever be profitable. Electronics and furniture cap at 1.2 to 1.5x first-purchase value because customers replace every 5 to 10 years. Subscription-friendly categories run 8 to 15x across a 3 to 5 year horizon. This is the number that gates strategic questions: launch a subscription, invest in retention engineering, expand the product line.
Best to compute all three. 90-day moves with acquisition quality, 1-year moves with retention investment, lifetime moves only with category-level strategy changes. When an operator reports "our LTV is $200", the first question is "at what window?" because the answer changes the decision tree.
The 5 levers that raise LTV (ranked by impact)
LTV raises are not equal. We run this analysis on most audits and the same five levers show up in the same order, with the same rough impact range. Ranked by measured lift across our 471-store sample:
1. Repurchase rate (highest impact). Moving repurchase rate from 25% to 40% lifts 12-month LTV by 50 to 80% in most categories. A 15-point repurchase lift compounds through every future cohort. Klaviyo flows, well-timed winback emails, and post-purchase product recommendations are the three moves that shift it most. Second-order flows set up inside 30 days of first purchase are worth more than any other retention investment we measure.
2. Subscription conversion (second-highest impact). Moving 10% of first-purchase customers onto a subscription (Recharge, Skio, Smartrr) lifts 12-month LTV by 40 to 70% because a subscription customer's LTV runs 4 to 8x a one-time customer's. Only works in consumables (beauty, food, supplements, pet, household). Apparel and home goods cannot fake this. For the right category, subscription is the single highest-impact LTV project.
3. AOV lift (medium impact). Post-purchase upsells, bundle pricing, free shipping thresholds, and cart-page add-ons move AOV by 15 to 30% in most stores. A 25% AOV lift raises LTV proportionally. Less impact than repurchase rate because it only compounds if the customer comes back, but higher return per hour of work (one landing page change vs a full email flow rebuild).
4. Retention-window length (medium-low impact). Extending the retention window from 6 months to 18 months via seasonal reactivation flows, product launches timed to cohort behavior, and reactivation discount offers adds 15 to 30% to LTV in most categories. The ceiling is lower because the retention curve flattens hard after month 12, and reactivation customers have lower subsequent repurchase rates than original retained customers.
5. Price increase (low impact but real). A 5 to 10% price raise typically lifts LTV by 5 to 10% if conversion rate holds. Most stores over-test discounts and under-test price increases. Price raises usually stick (attrition is 2 to 5% on a 5% raise) and compound through every future cohort. Small effect per lever, but easy.
The trap operators fall into is running all five levers in parallel and then not knowing which one moved the number. Best to sequence: repurchase rate first, subscription second (if applicable), AOV third. Measure each for 90 days before stacking the next.
Subscription vs repeat-purchase vs one-time-buyer LTV math
LTV math changes shape depending on the purchase pattern. Using one formula across all three produces wrong numbers for at least two of them. Here are the three shapes that cover 95% of Shopify stores.
Subscription model. LTV equals monthly revenue times gross margin times expected lifespan in months. A $35/month sub at 65% gross margin with 9 months lifespan gives $205 contribution-margin LTV. Stable, predictable, and decouples from acquisition quality. The key metric is months 2 and 3 retention, because 60% of subscription churn happens in the first 90 days.
Repeat-purchase model (non-subscription). LTV equals AOV times orders-per-customer times gross margin, where orders-per-customer comes from actual cohort data, not prediction. A beauty store at $54 AOV, 2.8 orders per customer, 70% gross margin has a $106 contribution-margin LTV. Applies to beauty refills, one-off supplements, pet consumables, food. The key metric is the gap between first and second purchase, because 50% of repeat customers are won or lost on order 2.
One-time-buyer model. LTV equals AOV times (1 + cross-sell rate) times gross margin. Cross-sell rate is the percentage who buy a complementary product inside 12 months. An electronics store at $195 AOV, 15% cross-sell, 30% gross margin has a $67 contribution-margin LTV. The model for electronics, furniture, appliances, and high-consideration one-offs. The lever is cross-sell, not repeat, because the primary purchase does not naturally repeat on a useful timescale.
Picking the right model matters more than picking the right number inside it. Applying repeat-purchase math to an electronics store overstates LTV by 100%+. Applying subscription math to apparel is even worse. Match the formula to the pattern first.
LTV:CAC ratio: the floor, the target, the ceiling
LTV:CAC is the ratio that decides whether a Shopify store is a business or a subsidy. The floor, target, and ceiling are all useful reference points operators confuse with each other.
The floor: 3:1. Below 3:1, the business is acquiring customers but not generating enough lifetime value to cover CAC, fulfillment, returns, and overhead. LTV is a gross-revenue number. The store still has to pay for COGS, shipping, payment processing, support, and the rest of the stack that eats 40 to 60% of revenue before it reaches net income. A store at 2:1 is technically losing money on every new customer once full-cost accounting is applied.
The target: 4:1 to 5:1. This is the zone where the business is funding its own growth. New cohort revenue covers acquisition, pays for retention investment, and leaves margin for reinvestment. Most stores we audit aim for this range explicitly.
The ceiling: 7:1 and above. Above 7:1 LTV:CAC, the store is almost always under-spending on acquisition and leaving growth on the table. The scenario we see most often: a beauty or food brand at 8:1 LTV:CAC that could push CAC to 1.5x current and still be at 5:1, which would double new-customer acquisition at healthy economics. Operators hit a CAC dollar target and stop, when the ratio says they could spend more profitably.
Caveats. Subscription-heavy stores with upfront billing can run at 2:1 because the cash collected funds the next cohort. Stores with long lead times and seasonal inventory need 4:1 or higher because cash is tied up. The ratio is a starting point, not gospel. Run it against the gross-margin-adjusted ceiling math (max sustainable CAC = LTV times gross margin divided by 3) and it becomes actionable. For more on matching LTV:CAC to acquisition math, see our CAC benchmarks by industry guide.
LTV by cohort: reading it without fooling yourself
Cohort LTV is the most useful cut and the one most operators read wrong. Two mistakes show up on almost every audit: blending cohorts (averaging across all customers instead of grouping by first-purchase date) and reading a young cohort as if it is mature.
Mistake one: blended LTV. Dividing total revenue by total customers gives blended LTV, which averages a 2024 customer with 14 months of repeat behavior against a 2026 customer with 2 months. The old customer had time to come back 3 times, the new one did not. Blended LTV overstates recent cohort performance and understates the retention trend. Shopify's default view is blended unless you drill into cohort. Always use cohort-grouped numbers.
Mistake two: reading young cohorts as if they are mature. A 60-day cohort cannot have a 365-day LTV yet. Some operators extrapolate ("on track for $X at day 365") using linear projection, which is wrong because retention curves are convex (most revenue lands in the first 120 days, the tail is thin). Better to extrapolate using the curve shape of an older matured cohort: if the last three 12-month cohorts showed 90-day LTV was 65% of 365-day LTV, then a 90-day number of $80 extrapolates to roughly $123 at day 365.
The right cohort read. Group customers by first-purchase month. Track each cohort's cumulative revenue per customer at day 30, 60, 90, 180, 365. Compare cohort-over-cohort at the same window age. A cohort whose 90-day LTV is $78 when the previous 6 cohorts were running $85 to $95 is showing a retention or quality issue. That is the signal. The magnitude of the signal is usually 10 to 15%, small enough to miss if you only look at blended LTV.
Best to run the cohort analysis monthly, watch the 90-day LTV trend across the last 12 cohorts, and treat any 15%+ drop as an urgent diagnostic. Most LTV erosion is visible in the 90-day window 6 to 9 months before it shows up in the 365-day number, which means the cohort read is the early-warning system.
Frequently asked questions
What is a good LTV for a Shopify store?
Which LTV Shopify app should I use?
How do I calculate LTV on Shopify without an app?
What is the difference between LTV and CLV?
Should I use gross revenue LTV or gross margin LTV?
Why is my predicted LTV so much higher than my observed LTV?
Shopify LTV calculation is where most acquisition math quietly breaks, because the wrong LTV input sends CAC ceilings, channel budgets, and retention investments in the wrong direction for months. Best to pull your cohort LTV from Shopify Analytics, compute 90-day, 1-year, and 12-month windows separately, apply gross margin, and match against the 3:1 LTV:CAC floor before touching anything else. If the 90-day LTV is below CAC, acquisition is the problem. If 90-day is healthy and 1-year is weak, retention is the problem. If both are healthy and LTV:CAC is above 7:1, the store is under-spending and leaving customers unbought. The formula is less important than picking the right one for the purchase pattern. Run the cohort read monthly, watch the 90-day trend across the last 12 cohorts, and the early-warning signal usually shows up 6 to 9 months before the 12-month number moves. The benchmark is the compass, not the answer, and the LTV math is the part of the Shopify dashboard most operators never actually read.
Get a full X-ray of your ad account
Paste your Meta and Google Ads. See exactly where signal is leaking. Free. 60 seconds.