What is a good ROAS for Shopify stores
Shopify ROAS benchmark numbers get quoted with no methodology, no channel split, and no margin context, which is why most operators end up scaling spend on a 3.5x platform-reported ROAS that actually loses money once shipping, COGS, and returns hit the P&L. Across our sample of 471 audited Shopify stores, blended ROAS sits at 2.1x and platform-reported ROAS sits at 3.4x. The 1.3x gap is where the business actually lives, and most operators never look at it. Meta runs higher reported ROAS than Google but lower blended. TikTok looks great at small spend and collapses above $30k a month. Pinterest converts cheap traffic with low signal density that breaks at scale. Best to compute three ROAS numbers (platform, blended, margin-adjusted), match each to the right benchmark, and read your break-even floor before judging whether the account is healthy. Reported ROAS alone tells you almost nothing about whether the store is making money.
- Blended ROAS median (2026): 2.1x. Platform-reported median: 3.4x. The gap is real spend.
- Channel matters more than industry. Meta-heavy and Google-heavy stores have different ROAS shapes.
- Margin-adjusted ROAS (the only one that maps to profit) needs gross margin in the formula.
- Break-even ROAS depends on margin, not on what the agency tells you. Compute it before scaling.
Why "what is a good ROAS" is the wrong question
Shopify ROAS benchmark queries get answered with a single number, usually 3x or 4x, usually pulled from a vendor blog post that never defined which ROAS or which channel. That single number is almost always wrong for the store asking the question, because ROAS comes in at least three flavors and they all move independently. Platform-reported ROAS (what Meta or Google shows you in the dashboard), blended ROAS (total revenue divided by total ad spend across all channels), and margin-adjusted ROAS (the only number that maps to actual profit) answer different questions. Confusing them is how stores end up scaling spend on a "great" 3.5x reported ROAS that turns out to be a 1.4x blended ROAS that loses money once shipping and COGS land on the P&L.
The short version: a good ROAS depends on your gross margin, your channel mix, your AOV, and your attribution window. A 2x ROAS in a 70% margin beauty brand is profitable. A 4x ROAS in a 30% margin electronics store loses money on every order once full-cost accounting hits. The number alone is meaningless without the margin context. Triple Whale's ecommerce benchmark reports publish blended ROAS trends across thousands of brands and consistently show the platform-reported vs blended gap. Meta's Advantage+ Shopping help center documents how reported ROAS gets calculated inside Ads Manager, which is the source of the inflation. Google's target ROAS bidding guide covers the platform side from the Google angle. This guide cuts the data by channel, by industry, and by margin so the number is actually usable.
Below 1.5x blended ROAS the business is almost certainly losing money on paid acquisition once you account for shipping and returns. Above 5x blended ROAS the store is either subscription-heavy (where retention math changes the calculation) or under-spending on growth. Both extremes need a deeper read before anyone touches budgets.
Platform ROAS vs blended ROAS vs margin-adjusted ROAS
The single biggest mistake we see in audits is operators reading platform-reported ROAS as if it were the truth. Meta and Google both inflate ROAS by counting view-through conversions, by attributing sales to ads that may not have caused them, and by double-counting the same purchase across overlapping campaigns. Reported ROAS in Meta Ads Manager runs 30 to 60% higher than blended ROAS for the same period, every time, across every store in our sample. The pattern is so consistent that we use the gap as a tracking-health signal. A gap above 80% usually means duplicate Purchase events firing on the pixel.
The three ROAS numbers, defined cleanly:
| Metric | Formula | What it tells you |
|---|---|---|
| Platform-reported ROAS | Revenue (per platform) / Spend (per platform) | What the algorithm "thinks" it generated |
| Blended ROAS | Total store revenue / Total ad spend (all channels) | Real top-line efficiency of paid spend |
| Margin-adjusted ROAS | (Revenue x Gross Margin %) / Spend | Whether the spend actually makes money |
Blended ROAS is the honest number for top-line health. Margin-adjusted ROAS is the honest number for profitability. Platform ROAS is useful for comparing creative and audiences inside one channel, and useful for almost nothing else. Operators who optimize against platform ROAS exclusively end up scaling the campaigns that look best in Meta and quietly draining the bank account, because Meta is happy to claim credit for sales that would have happened from email or organic anyway.
The fastest way to spot the problem in your own account: pull last month's total store revenue from Shopify, divide by total ad spend across every channel (Meta + Google + TikTok + Pinterest + affiliate), and compare to the sum of platform-reported revenue inside Meta and Google. If the gap is above 40%, your reported ROAS is lying. The blended number is the one to trust.
Benchmarks by channel: Meta, Google, TikTok, Pinterest
Shopify ROAS by channel is the cut that matters most after the platform vs blended distinction. Each channel has a different signal density, different optimization model, and different attribution behavior, so the ROAS numbers are not comparable across channels without context.
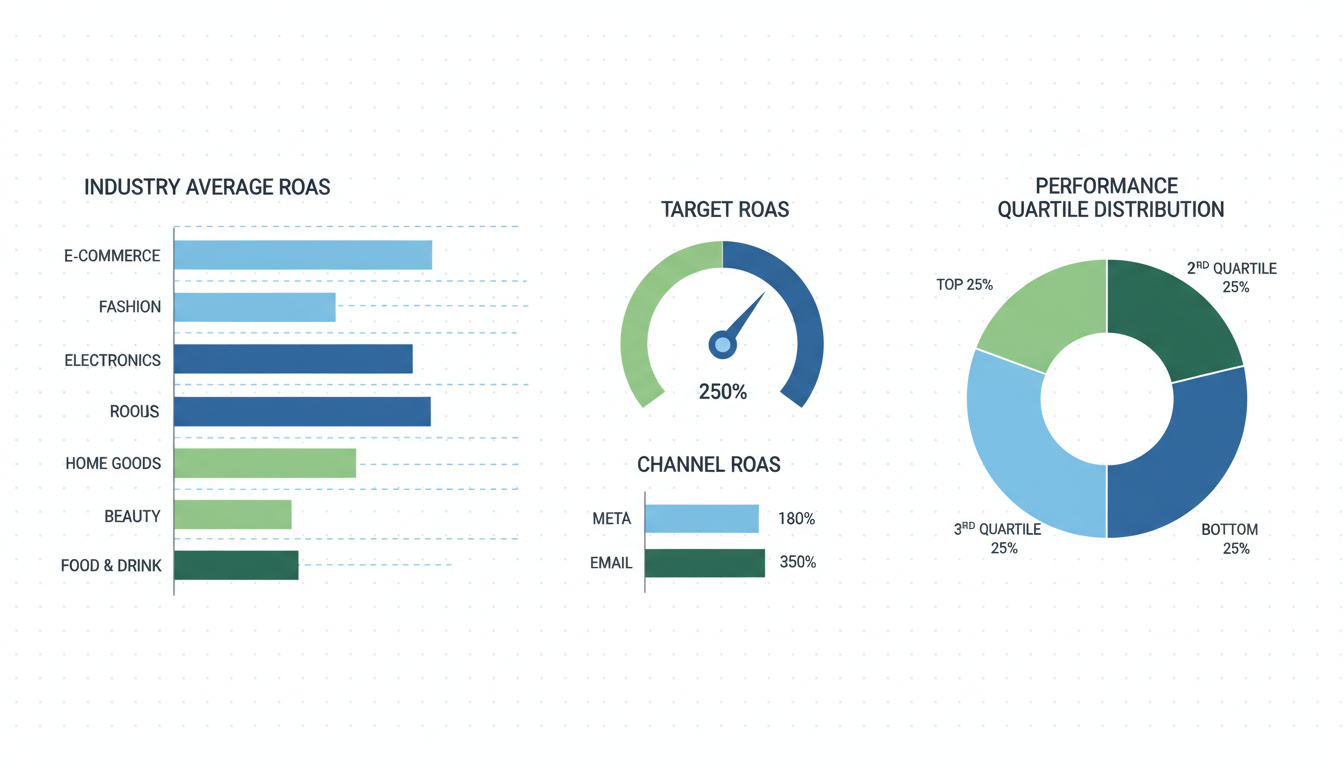
Channel ROAS, 2026 (median across our sample, apparel and beauty subset n=222):
| Channel | Platform-reported ROAS | Blended attribution ROAS | Notes |
|---|---|---|---|
| Meta (Advantage+ Shopping) | 3.6x | 2.2x | Inflation gap is the widest. View-through is the culprit. |
| Google (Search + PMAX) | 4.1x | 2.8x | Closer to truth because intent traffic actually converted. |
| TikTok (Spark Ads) | 5.2x | 1.9x | Best looking platform number, worst real efficiency at scale. |
| Pinterest (Standard + Idea ads) | 2.4x | 1.6x | Lower reported ROAS, but signal density is poor for scaling. |
Meta runs 3.6x reported ROAS but 2.2x blended in our sample. The gap is mostly view-through conversions on Advantage+ Shopping (someone saw the ad, did not click, bought 7 days later from organic search, Meta took the credit). Google runs 4.1x reported and 2.8x blended, a tighter gap because Search converts on intent traffic that actually came from a click. TikTok shows the widest gap of any channel: 5.2x reported, 1.9x blended. The dashboard looks like the best channel in the account. The bank statement disagrees.
Pinterest is the inverse: lower reported ROAS but the gap to blended is small, so what you see is closer to what you get. The catch is that Pinterest signal density (events per dollar of spend) is too low for the algorithm to optimize cleanly above $15k a month, so blended ROAS drifts down hard at scale.
Best to set channel-level ROAS targets against the blended column, not the reported column. A "Meta is at 4x reported" claim from an agency means roughly 2.5x blended, which is fine if your margin supports it and dangerous if it doesn't. Read the platform number for relative campaign comparison inside one channel. Read the blended number for budget allocation across channels.
Benchmarks by industry: apparel, beauty, supplements, home, electronics, food
Industry sits behind channel as a ROAS lever, but it still moves the number meaningfully because product margin and category competition both vary by industry. The same channel mix produces different ROAS in different categories, even at identical spend levels.
Blended ROAS by industry, 2026 (median across our sample):
| Industry | Blended ROAS (median) | 25th percentile | 75th percentile | Sample size |
|---|---|---|---|---|
| Apparel and fashion | 2.2x | 1.6x | 3.0x | 128 |
| Beauty and personal care | 2.6x | 1.9x | 3.4x | 94 |
| Supplements and wellness | 2.4x | 1.7x | 3.2x | 67 |
| Home goods and decor | 1.8x | 1.3x | 2.5x | 83 |
| Electronics and accessories | 1.5x | 1.0x | 2.1x | 31 |
| Food and beverage | 3.1x | 2.4x | 4.0x | 42 |
| Pet products | 2.5x | 1.8x | 3.3x | 26 |
Food and beverage runs the highest blended ROAS (3.1x median) because intent is high and AOV is low, so paid traffic converts at a high rate per impression. Beauty and pet cluster around 2.5x because category-fit creative compounds well on Meta. Supplements (2.4x) and apparel (2.2x) sit in the middle, with the spread driven mostly by margin variance inside the category. Home goods (1.8x) and electronics (1.5x) carry the lowest ROAS because AOV is high, the consideration cycle stretches across multiple sessions, and the buyer comparison-shops against Amazon listings that bid hard on the same keywords.
If you are running an electronics store at 1.6x blended ROAS and reading a blog post that says "good Shopify ROAS is 4x", you are about to make budget decisions against the wrong benchmark. Your 1.6x is just above category median. The ceiling worth chasing is around 2.1x (the 75th percentile), which is real work but not a four-alarm fire. Generic ROAS benchmarks borrowed from food and beverage will send an electronics operator into a panic that wastes a quarter on the wrong project.
The margin-adjusted ROAS formula that tells the truth
Margin-adjusted ROAS is the only number that tells you whether paid spend actually makes money, and most operators never compute it. The formula is straightforward: margin-adjusted ROAS equals (Revenue x Gross Margin %) divided by Ad Spend. If your blended ROAS is 2.5x and your gross margin is 60%, your margin-adjusted ROAS is 1.5x. If gross margin is 40%, the same blended ROAS becomes 1.0x, which is break-even before you account for fulfillment, returns, and overhead. Same dashboard number, completely different business outcome.
Worked examples across our sample:
| Industry | Blended ROAS | Gross Margin | Margin-Adjusted ROAS | Profitable? |
|---|---|---|---|---|
| Beauty (subscription refill) | 2.6x | 70% | 1.82x | Yes, healthy |
| Apparel (full-price) | 2.2x | 55% | 1.21x | Marginal |
| Supplements (DTC) | 2.4x | 65% | 1.56x | Yes |
| Home goods (custom) | 1.8x | 45% | 0.81x | No, losing |
| Electronics (resale) | 1.5x | 30% | 0.45x | No, losing badly |
| Food and beverage (DTC) | 3.1x | 40% | 1.24x | Marginal |
| Pet products (treats) | 2.5x | 50% | 1.25x | Marginal |
This is where most operators panic the first time they run the math. Three out of seven industries in the sample run margin-adjusted ROAS below 1.5x at the median, which means the median store in those categories is barely covering ad spend with gross profit and definitely not covering shipping, returns, and overhead. Electronics at 0.45x is the worst case in the sample: the median electronics store loses 55 cents on every dollar of ad spend before fixed costs hit. That math is sustainable only if LTV recovers the loss through repeat purchases, and electronics has the worst repeat-purchase profile of any category.
The honest target is margin-adjusted ROAS above 1.5x for direct profitability and above 2.0x to cover overhead. Anything below 1.0x means the business is buying revenue at a loss and hoping the LTV math eventually catches up. Sometimes it does. Often it doesn't.
Break-even ROAS: the floor nobody calculates
Break-even ROAS is the number every operator should know cold and almost none do. It is the floor below which paid spend stops contributing to profit, and it depends on exactly one variable: gross margin. The formula is 1 divided by gross margin percentage. A 50% margin store breaks even at 2.0x ROAS. A 30% margin store breaks even at 3.33x. A 70% margin store breaks even at 1.43x.
Break-even ROAS by margin (memorize this table):
| Gross Margin | Break-Even ROAS | Notes |
|---|---|---|
| 80% | 1.25x | Software, digital products |
| 70% | 1.43x | Beauty, premium DTC |
| 60% | 1.67x | Healthy DTC apparel |
| 50% | 2.00x | Average DTC |
| 40% | 2.50x | Food and beverage, low-margin apparel |
| 30% | 3.33x | Electronics, resale |
| 20% | 5.00x | Distribution, pure resale |
This is the single most useful piece of math in the whole guide. If your gross margin is 50% and your blended ROAS is 1.8x, you are below break-even on paid spend. The agency reporting 3.5x platform ROAS is reporting noise. The store is losing money on every paid order once you account for COGS alone, before shipping, before returns, before any fixed cost.
The trap most operators fall into is using contribution margin (revenue minus only the variable cost of goods) instead of true gross margin (which also includes inbound shipping, payment processing, and fulfillment-side variable costs). Contribution margin runs 8 to 12 percentage points higher than gross margin on most Shopify stores, which means the spreadsheet break-even number looks healthier than the P&L break-even number. Use the gross margin from your actual financials, not the COGS sheet from the supplier.
Break-even is the floor, not the target. Sustainable profit usually requires running at 1.5x to 2.0x of break-even. So a 50% margin store that breaks even at 2.0x ROAS should target 3.0x to 4.0x blended ROAS to actually generate profit after overhead. That is the realistic target, and it is much higher than the platform-reported number most operators chase.
Reading your own ROAS against the benchmark
Reading your own ecommerce ROAS benchmark against the right slice takes 15 minutes and saves a quarter of wrong budget decisions. The process we run on every audit:
- Pull last 90 days of total store revenue from Shopify Analytics. Pull total ad spend across every channel (Meta + Google + TikTok + Pinterest + affiliate + anything else). Compute blended ROAS = revenue / spend. Round to one decimal.
- Pull platform-reported ROAS from each channel separately. Sum the platform-reported revenue and divide by total spend to get a "platform-blended" number. Compare to the true blended ROAS from step 1. The gap is your attribution inflation.
- Pull your gross margin from the most recent P&L (the actual one, not the contribution margin spreadsheet). Compute margin-adjusted ROAS = blended ROAS x margin %.
- Compute break-even ROAS = 1 / margin %. Compare to your blended ROAS.
- Match your industry and channel mix to the tables above. Note where you fall against the median and the 75th percentile.
- The diagnostic: if blended ROAS is below break-even, the spend is losing money before any other cost hits. If blended ROAS is above break-even but margin-adjusted ROAS is below 1.5x, the spend is barely contributing. If margin-adjusted ROAS is above 2.0x and you are below the 75th percentile for your industry, there is room to scale.
A worked example. A supplements store at $180k monthly revenue, $52k monthly ad spend, 65% gross margin, 75% Meta / 25% Google mix. Blended ROAS is 3.46x. Platform-reported across both channels is 4.8x (for an inflation gap of 39%, normal). Margin-adjusted ROAS is 3.46 x 0.65 = 2.25x. Break-even is 1 / 0.65 = 1.54x. The store is running 2.25x margin-adjusted against a 1.54x break-even floor, which means roughly 71 cents of every paid revenue dollar contributes to overhead and profit after gross margin. Industry median is 2.4x blended for supplements, this store is at 3.46x, so it is running well above category median. Verdict: scale carefully, the math supports it.
The trap most operators fall into is reading platform-reported ROAS against an industry benchmark and skipping the margin step entirely. "Our ROAS is 4x and the benchmark says 3x is good, so we're crushing it" is backwards reasoning if margin is 35% (break-even 2.86x) and blended ROAS is actually 2.4x once attribution inflation is removed. The store is barely above break-even, the agency report says hero numbers, the bank account says something else. Get the slice right, then the margin math, then the break-even floor. The benchmark is the compass, not the destination.
Frequently asked questions
What is a good ROAS for a Shopify store in 2026?
Why is my platform-reported ROAS so much higher than my actual revenue suggests?
How do I calculate margin-adjusted ROAS the right way?
Should I judge each channel against a different ROAS target?
Is TikTok worth running if blended ROAS is so much lower than reported?
What's the relationship between ROAS and break-even when scaling spend?
Shopify ROAS benchmark numbers only matter when you separate the three ROAS metrics, match each to the right slice, and check against your real break-even floor. Generic "good ROAS is 4x" claims are where most quarterly budget decisions go sideways. Best to pull your 90-day blended ROAS, compute margin-adjusted ROAS using actual gross margin from the P&L, calculate break-even as 1 divided by margin, and read your number against both the industry table and the channel table above. If margin-adjusted ROAS is above 1.5x and blended ROAS is at or above the 75th percentile for your industry, there is room to scale. If margin-adjusted ROAS is below 1.0x, the spend is losing money before any other cost hits the P&L, and no amount of creative testing will fix the math. Run the 15-minute read above before you raise spend, cut spend, or fire the agency, because nine times out of ten the real story is sitting in the gap between platform-reported ROAS and the bank account, in a margin calculation nobody opened this quarter.
Get a full X-ray of your ad account
Paste your Meta and Google Ads. See exactly where signal is leaking. Free. 60 seconds.