How to use Meta Ad Library to steal Shopify competitor plays
Meta Ad Library Shopify research beats every paid spy tool for 90% of what a growth-stage operator actually needs, and most teams either never open it or open it once and miss the four signals that matter. The free Library shows you every active ad your competitor is running, when each one was first seen, how many variations they spun off the same hook, and (in EU markets) the impression range Meta reports under the Digital Services Act. Stack those four data points and you can read a competitor's creative velocity, scale bucket, winning hook, and offer rotation without paying $149 a month for AdSpy or PowerAdSpy. The 7-step protocol below takes 25 minutes per competitor, runs on public data only, and surfaces the same intelligence agencies charge $2k a month for. Run it weekly on your top three competitors and your creative pipeline stops guessing.
- The Ad Library shows active ads, first-seen dates, creative count per hook, and EU impression ranges.
- Creative velocity (new ads per week) tells you who is winning, not ad count.
- Active ad count maps cleanly to spend bucket: 1-5, 5-20, 20-50, 50+ ads.
- EU DSA disclosures give you a real impression number for any EU-targeting brand.
What Meta Ad Library actually shows and what it hides
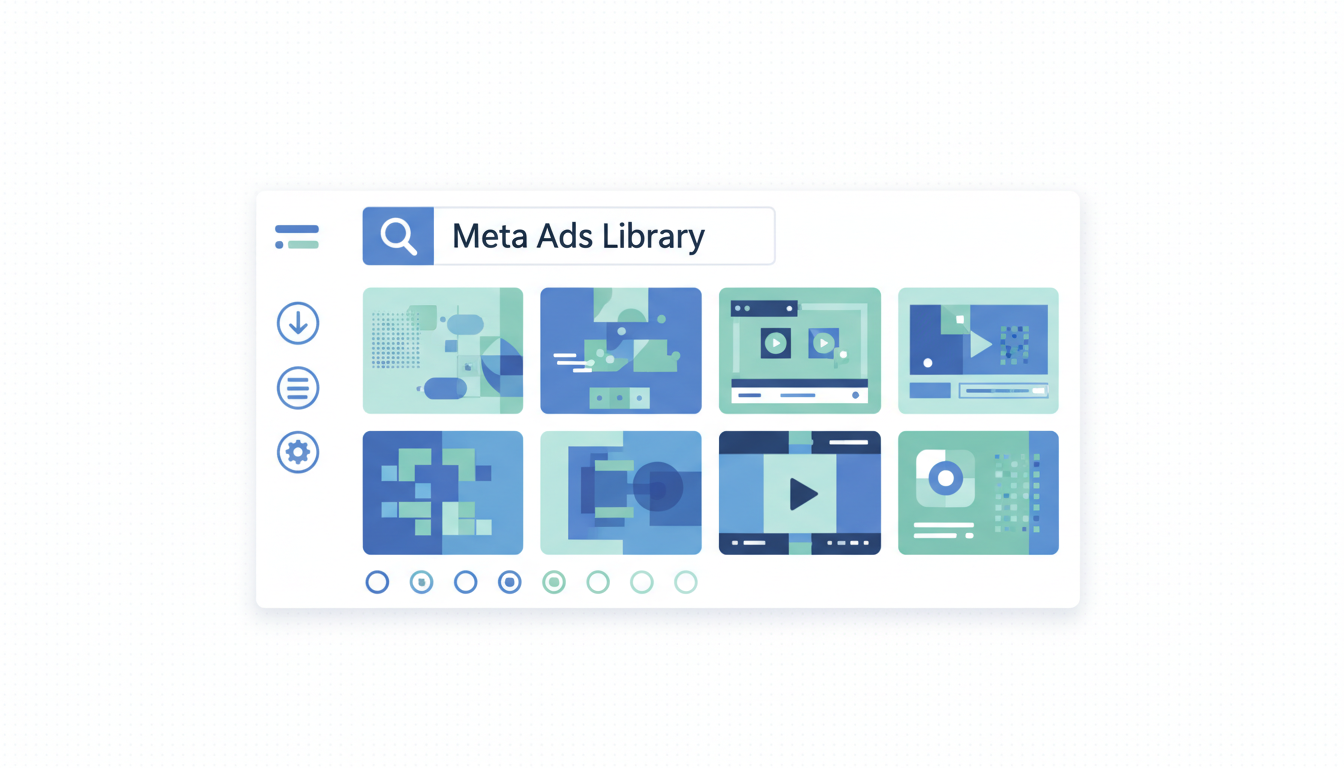
Meta Ad Library is the public archive of every ad currently running on Facebook, Instagram, Messenger, and Audience Network. Open facebook.com/ads/library, search any brand name, filter by country and ad category. You see the live creative, the start date, the platforms it runs on, and (in the EU and UK) an impression range and demographic breakdown. That is the surface. What most operators miss is the data sitting one layer down: how many variants of the same hook the brand is running, when each one entered the rotation, which countries each ad targets, and what the brand's creative velocity looks like over the trailing 30 days.
What the Library does not show you, in any market: exact spend, exact ROAS, click-through rate, conversion rate, audience targeting (interests, lookalikes), placement breakdown, or attribution windows. Anyone selling you a tool that claims to show those numbers from public data is making them up. The Library shows what is running. The performance numbers stay inside the advertiser's Business Manager. That is the line, and any meta ad library shopify research workflow that pretends otherwise will burn your team's time on fake intelligence.
The useful trade is this: you cannot see what works for your competitor in dollar terms, but you can see what they keep running and what they kill. A creative that has been live 30 days is a creative that is paying for itself, because Meta's auction is unforgiving and brands kill losers fast. A creative that lasted 4 days then disappeared was a test that failed. Cross-reference the survivors against your own creative library and you have a free signal of what hooks are working in your category. That is the entire game.
The 7-step competitor research protocol
This is the protocol we run on every new audit client before we touch their ad account. Takes 25 minutes per competitor. Free, repeatable, and catches more than 90% of what a $149-a-month spy tool would surface.
- Identify your real top 3 competitors. Not the brands you wish you competed with. The brands actually showing up in your category's organic search results, your category's "frequently bought with" suggestions, and your customers' top-of-mind list. Ask 5 recent customers "who else did you consider" if you do not have a clear list.
- Open the Meta Ad Library and search each brand name. Filter to "All ads", set country to your primary market.
- Count active ads. This is your scale bucket signal. Section 4 maps the count to spend ranges.
- Sort by start date, oldest first. Note the oldest active creative. If anything is older than 60 days, that is a proven evergreen winner. Save the screenshot.
- Sort by start date, newest first. Count creatives launched in the last 7 days, then last 30 days. That is your creative velocity number. Section 3 explains what to do with it.
- Group creatives by hook (visual angle, headline angle, offer angle). A brand running 12 active ads that are really 3 hooks with 4 variations each is testing iteration. A brand running 12 unrelated hooks is throwing spaghetti.
- Switch country filter to an EU country (Germany, France, Spain). If the brand targets EU, you get the DSA impression range and demographic breakdown for free. Section 5 covers how to read this.
That is the whole protocol. No tool, no login, no paid subscription. The output is a one-page brief per competitor: scale bucket, velocity rate, top 3 hooks, oldest evergreen winner, and (if EU-targeting) impression range. We file these in the audit folder and revisit weekly. Most agency competitor research products charge for exactly this output, dressed up with a logo on top.
Reading creative velocity: how often your competitor tests
Creative velocity is the single most important number you will pull from the Library, and it is the one most operators do not compute. Velocity is new creatives uploaded per week, trailing 30 days, divided by 4. Not active ads. Not total ads. New ads added to the rotation per week.
The reason velocity matters more than ad count: in 2026 the brands winning on Meta are the brands shipping creative fastest, because iOS 18 and Android 15 both shortened how long any single ad stays useful (we cover this in detail in the creative fatigue guide). A brand running 50 active ads that are all 45 days old is a brand coasting on inventory and about to collapse. A brand running 12 active ads with 6 launched in the last 7 days is a brand outpacing the algorithm's fatigue curve. The 12-ad brand is winning, even though the 50-ad brand looks bigger on the surface.
Rough velocity benchmarks for Shopify brands in apparel, beauty, supplements, and home goods (the 4 categories where we have the largest audit sample):
- Below 1 new creative per week: brand is starving the algorithm. Either spend is below $5k a month or the operator is asleep at the wheel. Easy to outpace.
- 1 to 3 new creatives per week: typical mid-market Shopify brand spending $10k to $50k a month. Sustainable but not aggressive.
- 3 to 7 new creatives per week: brand is investing in creative pipeline. Probably has an in-house creator or a creative-first agency. Spend likely $50k to $200k a month.
- 7+ new creatives per week: brand is running a creative factory. UGC pipeline, designer plus editor on staff, weekly briefs. Spend over $200k a month, almost always. These are the brands setting the pace in their category.
If your top competitor is at 7+ and you are at 1, the gap is not creative quality. The gap is volume. You will lose the auction over 90 days even if every individual ad you ship is better, because Meta needs fresh inputs to optimize against and the brand starving the algorithm always loses to the brand feeding it. Best to fix velocity first, polish second.
Reading scale bucket from active ad count
Active ad count does not tell you exact spend, but it maps to a spend bucket cleanly enough to be useful. The buckets we use, calibrated against 200+ Shopify accounts we have audited where we know both the active ad count and the actual monthly spend:
- 1 to 5 active ads: under $5k a month on Meta. Either a brand testing the channel or a brand that has given up on it. Often the second.
- 5 to 20 active ads: $5k to $30k a month. Standard mid-market range. Most Shopify brands sit here.
- 20 to 50 active ads: $30k to $150k a month. Brand is scaling, has a real creative pipeline, probably running Advantage+ Shopping plus a few manual prospecting campaigns.
- 50 to 150 active ads: $150k to $750k a month. Mature DTC brand or fast-growing scale-up. Multiple campaign objectives, geo splits, retargeting layers, the works.
- 150+ active ads: $750k+ a month. Top 1% of Shopify by spend. You are looking at brands like Liquid Death, Ridge, Vuori, Olipop. Their playbook is not your playbook unless your spend is in the same bracket.
The buckets are wider than they look on paper because Meta's auction is non-linear, and a brand running 50 ads against a niche audience can spend less than a brand running 20 ads against a broad audience. But for benchmarking against your own scale, the bucket is reliable enough to say "we are 2 brackets behind our top competitor" and act on it. That is the answer competitor research meta ads workflows are usually trying to produce, and the Library gives it to you for free.
One nuance: a single creative running across 5 placements (Feed, Stories, Reels, Marketplace, Audience Network) shows up as 5 separate entries in the Library. Group by creative ID (visible in the URL when you click through to "See ad details") to deduplicate. Otherwise you will overcount the brand's active ad pool by 2 to 3x and bump them into the wrong bucket.
The EU DSA impression range: using the number Meta does not advertise
The Digital Services Act, which kicked in across the EU in 2024 and tightened in 2025, requires Meta to disclose an impression range and demographic breakdown for every ad targeting EU users. You can see this data in the Ad Library by setting the country filter to any EU member state (Germany and France are the easiest because most international Shopify brands target both). What you get back: a range like "1M-2M impressions" and a breakdown by gender, age bracket, and country of delivery.
This is the closest thing to free spend data that exists. An ad showing "5M-10M impressions" over its lifetime, on a category-typical CPM of $14, was driven by roughly $70k to $140k in spend on that single creative. Cross-reference with the start date and you have a daily spend estimate per creative. Run this on a competitor's top 5 ads and you have a daily spend estimate for their whole Meta program, accurate to within roughly a 2x range. That range is good enough to confirm the bucket call from section 4 and good enough to flag when a brand is suddenly scaling spend hard on one specific hook.
The catches: the range is wide on purpose (Meta is not handing out exact numbers), it is impressions not spend (CPM varies by category and audience), and it only covers EU delivery (a US-focused brand barely shows up). For shopify ad spy on EU-targeting brands, the DSA range is the single most valuable free signal in the Library. For US-only brands, you fall back to the active ad count bucket from section 4.
The EU's transparency policies page on Meta's side covers what gets disclosed under DSA. The full EU DSA ads database on the European Commission site lets you query disclosures across all platforms, not just Meta, useful when you want to see what a competitor is running on TikTok and LinkedIn alongside Meta.
The 3 competitor research mistakes that waste your time
We see the same three mistakes on every account we audit when the operator says "we already do competitor research."
- Researching the wrong competitors. Most teams research the aspirational brand (the unicorn in their category) instead of the actual competitor (the brand stealing their checkout). Aspirational research is fun and useless. The unicorn is spending 10x your budget against a different funnel maturity. Their playbook will not work at your scale. Best to research brands within 2x of your spend bucket. Their plays actually translate.
- Counting ads instead of measuring velocity. Active ad count tells you bucket. Velocity tells you trajectory. A brand at 30 active ads with 0 new ads in the last 14 days is dying. A brand at 12 active ads with 8 new ads in the last 7 days is winning. Operators who only count totals miss the trajectory and end up copying the dying brand's evergreen creative right as it stops working. Track velocity, not totals.
- Copying the creative instead of decoding the hook. The visible ad is the output. The hook (the angle, the offer, the audience problem the ad addresses) is the input. Copying the visible ad gets you a worse version of someone else's work. Decoding the hook (why are they running 4 variations of "no-trees hammock setup," what audience pain does that solve) lets you produce better creative against the same hook. Hook research wins. Creative copying loses.
The Library is a hook discovery tool, not a creative bank. Every screenshot you save needs a one-line note: "what is this ad's hook, who is it for, what offer does it carry." That note is the artifact you brief your creative team with. The screenshot itself is just supporting evidence.
From research to your own creative brief in 30 minutes
The end of the protocol is a creative brief, not a folder of screenshots. Once you have the 7-step output for your top 3 competitors, the brief writes itself in roughly 30 minutes. The structure we use:
- Hook landscape (the 3-5 angles your category is currently leaning into). Pull from the hook decoding step. If 8 of 12 active ads across your top 3 competitors lean on a "fast setup" angle, that is your category's dominant hook this quarter. You either match it with a sharper version or counter-position against it.
- Velocity gap (where you are versus where they are). If your top competitor ships 6 new ads a week and you ship 1, the brief says "produce 4 new creatives this week minimum." Velocity targets are non-negotiable.
- Offer rotation (what offers are running where). Note every distinct offer in your top 3 competitors' ads (free shipping over $X, $Y off, bundle deal, BOGO, gift with purchase). Map your own offer against theirs. If everyone in category runs free shipping over $50 and you run flat-rate $7, the offer is your bottleneck before creative is.
- Evergreen winners to test against. The ads from competitors that have been running 60+ days are proven against your shared audience. Brief at least one creative test that goes head-to-head with the top evergreen ad in your category. Same offer, your hook, your brand voice. Run for 14 days and compare CTR.
We hand this brief to creative teams (in-house or agency) with a single rule: ship the first 3 variations within 5 business days. Faster ships beat polished ships, every time, when the algorithm is the customer. The brief, the velocity target, and the head-to-head test framework together turn a folder of competitor screenshots into a creative production schedule. That is the whole point of the research, and it is what most agencies skip when they sell competitor research as a standalone deliverable.
This research protocol is part of the audit we run on every new client account. We pull the Ad Library data on top 3 competitors, compute velocity gaps, and ship the creative brief inside the first audit week. Most clients have never seen this output before, and the gap between their creative velocity and their competitors' is usually the single biggest finding in the audit. The fix is structural (build a creative pipeline that ships 3+ ads a week), not tactical, and it pays back inside 60 days.
Frequently asked questions
Is Meta Ad Library actually free, or are there limits I should know about?
How is the Meta Ad Library different from paid tools like AdSpy or PowerAdSpy?
Can I see how much my competitor spends on Meta from the Ad Library?
How often should I run the protocol on my top competitors?
What if my competitor's Ad Library page is empty or barely shows any ads?
Does the Library show TikTok, Google, or LinkedIn ads as well?
library.tiktok.com, less complete than Meta's but improving. LinkedIn ads are visible on the brand's company page under "Ads" tab, no central library. Google has a Transparency Center at adstransparency.google.com covering Search, Display, YouTube, and Gmail ads. Run the same 7-step protocol on each platform separately. The cross-platform read (where is each competitor concentrating spend) is one of the highest-value outputs of a full competitor research workflow, and it is all free public data once you know where to look.Meta Ad Library Shopify research is one of those workflows that costs zero dollars and beats most paid alternatives once you stop treating it as a screenshot library and start treating it as a hook discovery system. The 7-step protocol takes 25 minutes per competitor, runs on public data, and outputs a creative brief that most teams pay agencies $2k a month for. Best to run it on your top 3 competitors this week before your next creative production cycle. If the velocity gap is wide (your competitor ships 5x your creative volume), that is the single biggest fix to make this quarter, and it ranks ahead of any tracking, targeting, or budget change. Creative velocity is the lever the algorithm rewards in 2026, and the Library is the cheapest way to measure where you stand against it.
Get a full X-ray of your ad account
Paste your Meta and Google Ads. See exactly where signal is leaking. Free. 60 seconds.