Cart abandonment rate benchmarks for Shopify
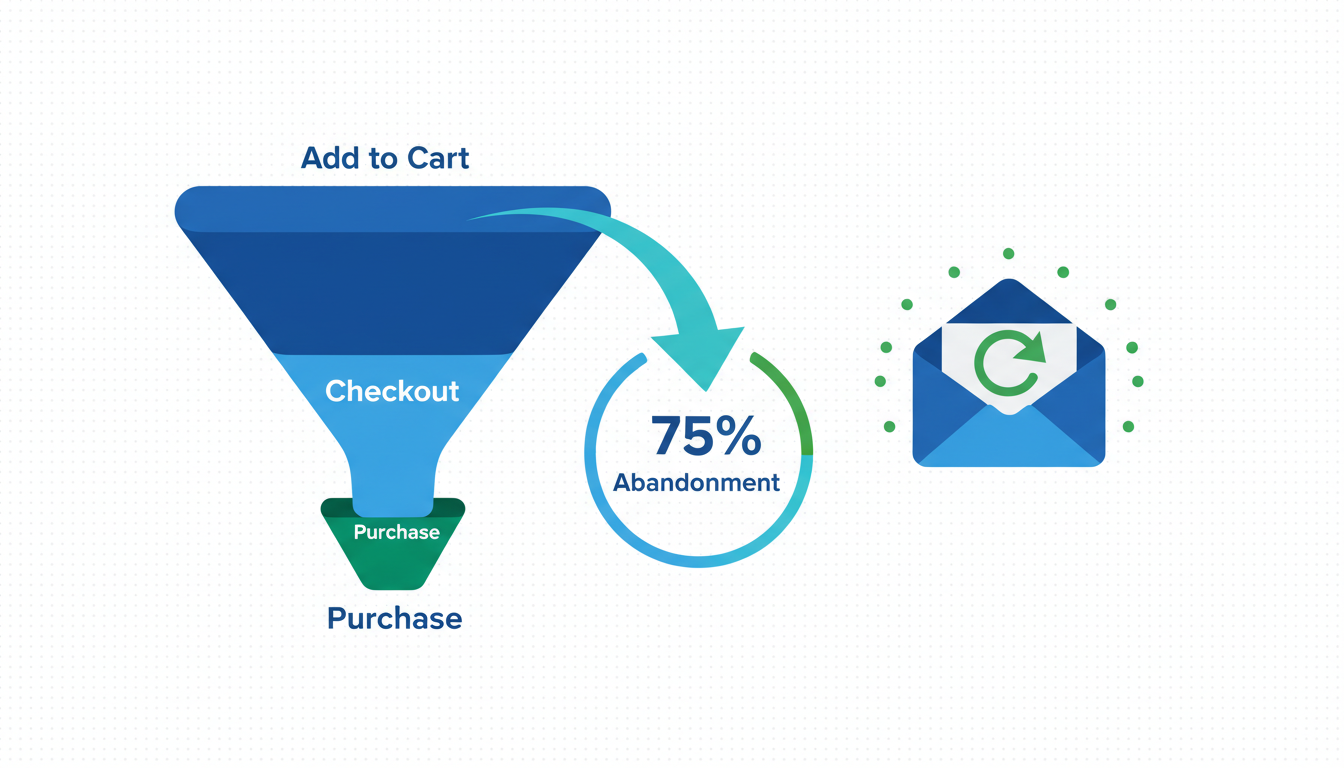
Shopify cart abandonment rate sits at a 70.19% global average and has barely moved in a decade, but that single number is where most stores make their first bad budget decision, because there are actually three different metrics hiding inside the word "abandonment" and each one points at a different fix. Cart abandonment (carts created minus orders) runs 65 to 78% on Shopify. Checkout abandonment (checkouts started minus orders) runs 40 to 55%, a totally different number. Recovery rate (the portion you can win back) caps out at 10 to 15% in 2026 even with a serious recovery stack. Confuse the three and you end up rebuilding the homepage when the real leak is shipping cost, or buying a recovery app when the real leak is forced account creation. Below are the benchmarks by industry, device, and payment method, plus how to read your own number honestly.
- Cart abandonment rate: 70.19% global average (Baymard), 65 to 78% on Shopify by industry.
- Checkout abandonment: 40 to 55% median, a different metric from cart abandonment.
- Recovery rate ceiling: 10 to 15% of abandoned carts with a full stack. Default Shopify email alone: 1%.
- Shop Pay at checkout cuts abandonment by ~14% vs guest-only flows.
What "cart abandonment" actually measures on Shopify (and the three definitions that confuse everyone)
Shopify cart abandonment rate is one of the most misquoted numbers in ecommerce, and the reason is that three different things get called "abandonment" across Shopify Analytics, GA4, and every blog post ranking for the term. The three are not interchangeable, and which one you are measuring decides which fix actually moves revenue.
The first is cart abandonment, which is carts created minus orders placed, divided by carts created. Baymard Institute's rolling average across 49 studies since 2006 sits at 70.19% globally, and that number has barely moved in a decade. The second is checkout abandonment, which is checkouts started (buyer entered the contact step) minus orders, divided by checkouts started. That one runs 40 to 55% on Shopify for most categories, because by the time someone entered their email on the checkout page they are much more likely to finish. The third is recovery rate, which is orders placed by previously-abandoned carts, divided by abandoned carts, over some window. That caps out at 10 to 15% in 2026 for stores running a full recovery stack.
Confusing them is the single most common diagnostic mistake we see in audits. A store quotes "our abandonment rate is 68%, which is better than the 70% industry average" without realizing they are looking at checkout abandonment in GA4, which should be around 45%. So the real number is significantly worse than they think, and the money is leaking in a place they are not looking. Best to pin down which of the three you are measuring before comparing anything to anything. The rest of this guide breaks out benchmarks for all three separately.
One note on Shopify Analytics specifically. The "Sales by checkout funnel" report shows sessions to added-to-cart to reached-checkout to completed. Cart abandonment hides in the gap between "added to cart" and "reached checkout". Checkout abandonment hides in the gap between "reached checkout" and "completed". Two different rows in the same report, two different fixes.
Cart abandonment rate benchmarks by industry
Cart abandonment benchmark ecommerce data from 2026 looks a lot like it did in 2022, because the underlying human behavior has not changed. What has changed is that some industries compressed their range (beauty and apparel moved down a couple of points) and others widened it (electronics and home goods stretched higher as AOV climbed). Industry is the cut that matters most, same pattern as conversion rate. Below is the cart abandonment rate (carts created minus orders) from our rolling 12-month sample of 471 Shopify audits between April 2025 and March 2026.
| Industry | Cart abandonment (median) | 25th percentile | 75th percentile | Sample size |
|---|---|---|---|---|
| Apparel and fashion | 72% | 66% | 78% | 128 |
| Beauty and personal care | 68% | 62% | 74% | 94 |
| Supplements and wellness | 74% | 68% | 80% | 67 |
| Home goods and decor | 76% | 70% | 82% | 83 |
| Electronics and accessories | 81% | 76% | 86% | 31 |
| Food and beverage | 64% | 58% | 70% | 42 |
| Pet products | 69% | 63% | 75% | 26 |
Food and beverage runs the lowest cart abandonment (64% median) because intent at session start is high and AOV is low, so buyers commit faster. Electronics runs the highest (81%) because AOV is $195+ and research cycles span 3 to 5 sessions, each one dragging the denominator up without adding orders. Home goods (76%) and supplements (74%) sit in the middle for similar trust-friction reasons: sofas feel risky on mobile, supplements need ingredient research. Apparel and beauty cluster around 68 to 72%, the canonical Baymard zone, because the category matches the dataset Baymard samples from most heavily.
If you are a supplements store at 74% cart abandonment and you are reading a blog post that says "good Shopify abandonment is under 60%", you are about to spend a quarter chasing a number your industry does not hit. 74% is the median for your category. Your realistic ceiling (25th percentile) is 68%, a 6-point gap, not a 14-point gap. That is the difference between rebuilding the cart page and tweaking the upsell copy. Different projects, different ROI.
Checkout abandonment rate (different number, different meaning)
Shopify checkout abandonment measures a different thing from cart abandonment, and the number is always lower, usually by a lot. The metric is orders divided by checkouts started, where "checkout started" means the buyer entered their email on the Shopify contact step. Because that email entry is a much stronger intent signal than adding to cart, the abandonment rate for this segment drops to 40 to 55% range for most categories. Same buyers, later in the funnel, and a very different picture.
| Industry | Checkout abandonment (median) | Typical range |
|---|---|---|
| Apparel and fashion | 52% | 42 to 62% |
| Beauty and personal care | 45% | 35 to 55% |
| Supplements and wellness | 38% | 28 to 48% |
| Home goods and decor | 55% | 45 to 65% |
| Electronics and accessories | 62% | 52 to 72% |
| Food and beverage | 32% | 22 to 42% |
| Pet products | 42% | 32 to 52% |
The pattern inverts compared to cart abandonment. Food and beverage and supplements run the lowest checkout abandonment because buyers who started checkout almost always finish, AOV is small and the commitment is low-risk. Electronics and home goods run highest because the final three steps (contact, shipping, payment) are where the sticker-shock moment hits: shipping cost on a $300 item is a different conversation than on a $40 item. Apparel sits in the middle because size-uncertainty and return-policy questions surface at the last moment.
The important call here: cart abandonment and checkout abandonment are diagnostic twins. If your cart abandonment is high but checkout abandonment is normal, the leak is upstream (product page, add-to-cart, cart page itself). If your checkout abandonment is high, the leak is the last three steps: something about contact, shipping, or payment is breaking the flow. Recovery emails fix cart abandonment. Checkout customization fixes checkout abandonment. Different problem, different tool, so it is worth separating them before you spend on either.
Baymard's 2024 survey of US checkout abandonment reasons: extra costs too high (48%), required account creation (24%), didn't trust the site with credit card (19%), too long or complicated checkout (18%), errors or crashes (13%). The pattern is structural, not creative, which is why a better ad image will not move it.
Mobile vs desktop abandonment gaps
Mobile-desktop abandonment is the most consistent pattern in the 2026 data and also the widest gap. Across every industry in our sample, mobile abandonment runs 4 to 9 points higher than desktop abandonment, even though mobile traffic is 65 to 80% of total sessions. So most stores are losing their biggest audience to the hardest-to-fix friction, and treating it as a fixed cost when it is not.
| Industry | Desktop cart abandonment | Mobile cart abandonment | Gap (points) |
|---|---|---|---|
| Apparel | 68% | 74% | 6 |
| Beauty | 64% | 70% | 6 |
| Supplements | 70% | 77% | 7 |
| Home goods | 71% | 80% | 9 |
| Electronics | 76% | 84% | 8 |
| Food and beverage | 61% | 66% | 5 |
| Pet products | 65% | 72% | 7 |
Home goods and electronics have the widest gaps (8 to 9 points) because high-AOV purchases on a small screen trigger every friction at once: shipping costs look bigger, product photos feel smaller, form fields require zooming. Food and apparel have the narrowest gaps (5 to 6 points) because the decisions are faster and the carts are smaller. The universal pattern: mobile is always worse.
The fixable piece is the checkout step. Mobile cart abandonment is partly structural (smaller screens, harder product evaluation), but mobile checkout abandonment should be within 2 to 3 points of desktop. When it is not, the culprit is one of three things: Shop Pay is off, shipping cost is revealed too late in the flow, or form fields require zooming on a 375px screen. Closing those three closes about 40 to 60% of the mobile gap, which moves blended revenue 8 to 15% in a month. Not a redesign. Three specific settings.
The trap here is treating mobile as a lost cause because "people just research on mobile and buy on desktop." That used to be true in 2018. In 2026, with Shop Pay saved-state and Apple Pay one-tap, mobile should be converting closer to desktop than it does. If it is not, the platform changed and your checkout did not keep up.
Recovery rate benchmarks: the 10-15% ceiling
Cart recovery rate benchmark is the metric that actually tells you how much of the 70% abandonment pool you can put back into revenue. And this is where the gap between what is possible and what most stores do is the widest. Default Shopify abandoned checkout email recovers around 1% of abandoned carts. A serious recovery stack recovers 10 to 15%. The ceiling has barely moved in three years and every benchmark study we have looked at lands inside that band.
Recovery rate by channel and stack maturity, 2026:
| Stack | Recovery rate | Notes |
|---|---|---|
| Default Shopify abandoned checkout email only | ~1% | Single email at 10 hours, generic subject line |
| 3-email Klaviyo sequence (1h, 24h, 72h) | 6 to 9% | Different angle per email, suppress on purchase |
| Email + TCPA-compliant SMS (hour 4) | 9 to 13% | SMS opt-in at checkout, not popup |
| Full stack (email + SMS + retargeting + exit intent) | 10 to 15% | Channel sequencing, day 1 to day 7 window |
Klaviyo's abandoned cart benchmark data lands in a similar band, reporting 3 to 5% recovery for a single-email setup and 8 to 12% for a properly-sequenced 3-email flow, so the ceiling holds across independent datasets. The 10 to 15% figure is not a skill issue, it is a behavioral ceiling. A chunk of abandoned carts are price-checking, comparison-shopping, or were never going to buy at all, so no sequence converts them. Above 15% recovery on a legitimate audit is rare and usually means somebody is counting assisted conversions that would have happened anyway, not true recoveries.
The gap between 1% (default) and 12% (middle of the full-stack band) is where the revenue lives. For a $1M store with 70% abandonment, total abandoned cart value is roughly $2.3M a year. 1% of that is $23k. 12% is $276k. Delta is $253k, and the stack that delivers it is not expensive or complicated: Klaviyo or Shopify Email plus one SMS platform plus Meta DPA retargeting plus an exit-intent app. The implementation is 2 weeks of work, and the recovery compounds monthly.
Our companion guide Shopify cart abandonment: 9 playbooks that recover revenue walks through the full sequencing, timing, and creative setup for the recovery stack. This page is the benchmark data. That page is the playbook.
Payment-method abandonment: Shop Pay cuts abandonment 14%
Payment method is one of the most under-measured variables in cart abandonment, because Shopify Analytics does not break it out by default. You have to segment manually or use a third-party analytics tool. When you do, the pattern is clean: stores with Shop Pay enabled see checkout abandonment about 14 points lower than guest-only flows on the same audience. That is not a small number. It is the single biggest single-setting lever in Shopify.
Shopify's own Shop Pay data lands in a similar zone, citing a 1.72x higher conversion rate for Shop Pay checkouts vs guest on average. Our audit sample shows a tighter band (14-point abandonment drop, roughly 1.4x to 1.6x conversion lift) because we control for industry and device, and the industry-blended number Shopify publishes pulls in some high-AOV apparel brands where the lift is larger.
Approximate abandonment rates by payment option used (checkout step only):
| Payment method | Checkout abandonment | Sample note |
|---|---|---|
| Guest checkout only (no accelerators) | 58% | Baseline |
| PayPal available | 51% | 7-point drop |
| Apple Pay available | 49% | 9-point drop |
| Shop Pay available | 44% | 14-point drop |
| Shop Pay + Apple Pay + PayPal | 38% | 20-point drop combined |
The compounding is real. Each accelerated checkout option catches a different buyer: PayPal for the buyer who does not trust your card form, Apple Pay for the iOS buyer who wants one-tap, Shop Pay for the returning Shopify buyer who saved their info last month on a different store. Stacking all three is the closest thing to a free 20-point abandonment reduction that exists on Shopify, and the implementation is toggling checkboxes in Settings, Payments.
One nuance: Shop Pay is strongest on returning Shopify shoppers (saved payment, saved address, one-tap checkout). On a brand new audience it performs more like Apple Pay. So the 14-point average masks a split: 20+ points for brands with a big repeat-customer base, 8 to 10 points for cold-traffic-heavy brands. Either way, the floor of the range is still bigger than any other single setting on the Shopify checkout.
If you have Shop Pay off, turn it on before you read any further. It will not fix a broken product page, but it will reclaim a chunk of revenue that costs zero to enable.
Reading your own abandonment rate honestly
Reading your own shopify cart abandonment rate against the benchmarks takes 15 minutes and saves a quarter of wrong decisions. The process we run on every audit:
- Pull your 90-day cart abandonment from Shopify Analytics. Reports, Sales by checkout funnel. Abandoned = (added to cart) minus (reached checkout). Divide by (added to cart) for the rate.
- Pull checkout abandonment from the same report. (Reached checkout) minus (completed), divided by (reached checkout).
- Split both by device. Shopify Analytics lets you segment by device on most of its checkout reports.
- Match to the industry tables above. Note your median, your 25th percentile (realistic ceiling), and the mobile gap.
- Check payment methods. Settings, Payments. Note whether Shop Pay, Apple Pay, and PayPal are all enabled.
- Pull recovery rate if you have a sequence running. Klaviyo, Shopify Email, or Omnisend all report it. Divide recovered orders by abandoned carts in the same window.
A worked example. An apparel store at 76% cart abandonment, 55% checkout abandonment, mobile split 72%, Shop Pay off, recovery rate 2%. Industry median is 72% cart abandonment, 52% checkout abandonment. Cart abandonment is 4 points above median, checkout is 3 points above, both close enough to the benchmark that the real leak is not there. The big leaks: Shop Pay off (turning it on closes 10 to 14 points on checkout abandonment) and recovery rate at 2% vs a 10 to 15% ceiling. Two projects, both higher-impact than anything involving the product page or the homepage.
The trap most operators fall into is comparing their number to the wrong definition or the wrong slice. "We are at 68% abandonment and the blog said 70% is average, so we are fine" is backwards reasoning if you are looking at checkout abandonment (which should be 45%, not 70%) and ignoring that your Shop Pay is off and your recovery rate is 1%. The number is not fine. The definition is wrong.
Get the slice right, pick the biggest gap, run the fix, retest in 30 days. That is the diagnostic loop. Anything else is guessing.
Frequently asked questions
What is a good cart abandonment rate for Shopify in 2026?
How is cart abandonment different from checkout abandonment on Shopify?
What's the realistic ceiling on cart recovery rate?
Does Shop Pay really cut abandonment by 14%?
Why is mobile cart abandonment always higher than desktop?
How do I calculate my Shopify cart abandonment rate manually?
Shopify cart abandonment rate is one of those metrics that gets quoted everywhere and measured carefully almost nowhere, because the same word covers three different things and most stores are looking at the wrong one. Cart abandonment is 65 to 78% on Shopify depending on industry. Checkout abandonment is 40 to 55%, a totally different number. Recovery rate caps at 10 to 15% with a full stack, vs 1% with the Shopify default. Shop Pay cuts checkout abandonment by about 14 points. Mobile runs 4 to 9 points higher than desktop across every category, and most of that gap is fixable. The benchmarks above are the 2026 data cut by the slices that actually matter: industry, device, payment method. Match your number to the right slice, find the biggest gap, run the fix. The benchmark is the compass, not the destination. And if the diagnostic surfaces a recovery gap vs a checkout gap, the playbooks live in the companion guide, not here.
Get a full X-ray of your ad account
Paste your Meta and Google Ads. See exactly where signal is leaking. Free. 60 seconds.