How to find wasted Google Ads spend on your Shopify store
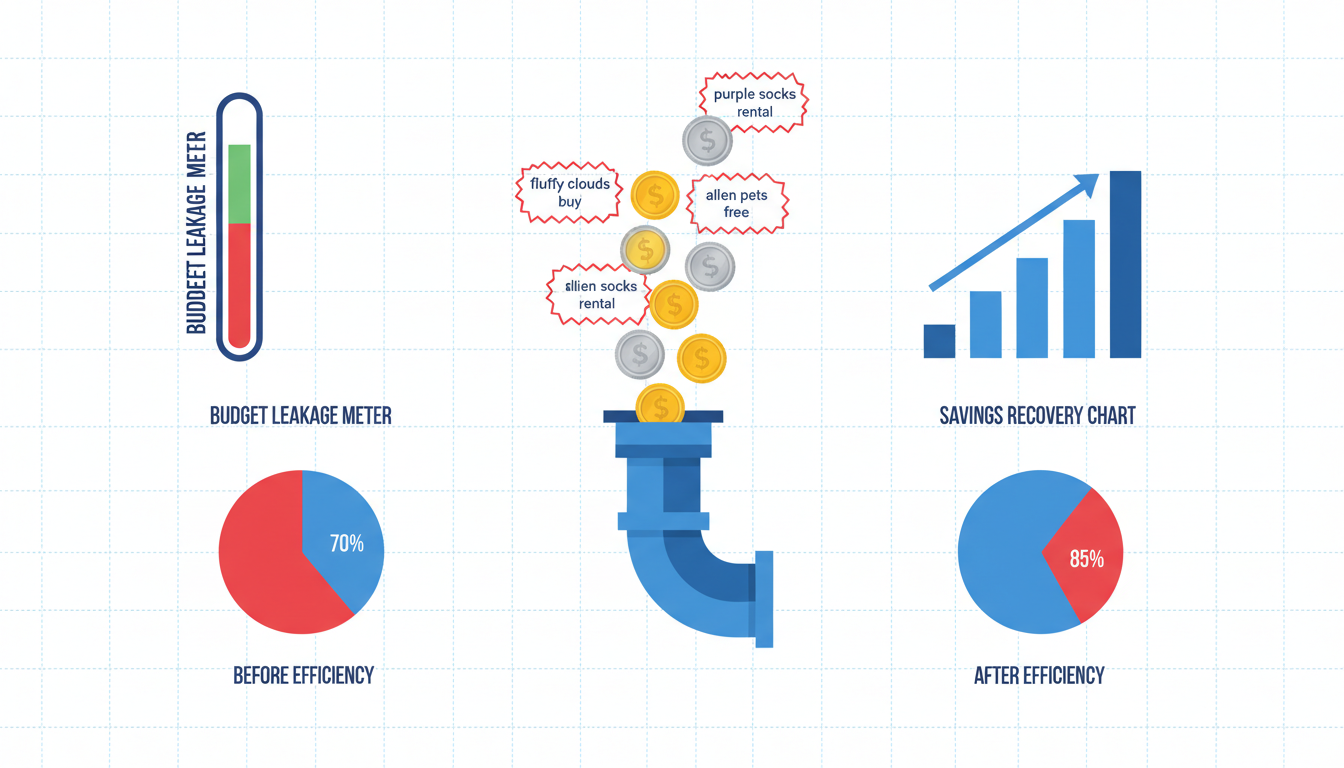
Shopify Google Ads wasted spend is the single biggest hidden line item in most growth-stage ecommerce P&Ls, and nobody on the team knows it is there until somebody runs the audit. Across the 40-odd Shopify accounts we audit each month, the average store burns 28 to 42% of its Google Ads budget on clicks that never had a realistic shot at becoming revenue. The money leaves in five specific ways, every time: irrelevant search terms Google matches you to, keywords sitting at Quality Score 4 or below, PMax asset groups with no product or brand exclusions, no dayparting on accounts that mostly convert during business hours, and geo targeting that quietly serves ads into zip codes where your ROAS is 0.3. Pull each one, stack the savings, and the typical store recovers 30% of spend inside a month without touching budget.
- Search terms report: pull 90 days, kill everything below 1.5x ROAS.
- Quality Score: flag anything at 4 or below, rewrite or pause.
- PMax: add brand exclusions and a product exclusion list.
- Dayparting and geo: match bid schedule to when and where revenue actually lands.
What "wasted spend" actually means and why the number looks bigger than you think
Wasted Google Ads spend on a Shopify store is any click that had a structurally low chance of converting before the auction even ran. Not clicks that happened to miss. Clicks that were mispriced, misrouted, or aimed at a query that never matched your product. The distinction matters because Google's reporting blends both together under one "cost" column and nobody ever separates them. So the account looks like it is performing at a 2.1 ROAS when really it is running a 3.8 on the good half and a 0.4 on the other half, averaging out to something that looks okay and is quietly capping the whole business.
The framing that works best in client conversations: imagine two Google Ads accounts sitting inside the account you have now. Account A contains the queries, keywords, times of day, and geographies that actually convert. Account B contains the ones that never will. Same budget, same platform, same team. The whole job of an audit is separating the two so you can starve B and feed A. Google's Search Terms report documentation is where this work starts, though the doc itself does not tell you what to cut. That is the skill part.
One thing to be upfront about. The 28 to 42% waste number we cite above is a range we see in audits, not a guarantee. Some accounts are cleaner. A handful are worse, sometimes 60%+ when PMax is left wide open and dayparting was never configured. So the actual number for your store sits somewhere on that curve and you will not know where until you pull the reports. Do not assume the audit will confirm a specific figure. Assume it will find a real one, which is usually enough.
Source 1: search terms that bleed into irrelevant queries
Every Shopify store running broad or phrase match keywords ends up paying for queries that have nothing to do with the product. Broad match is the worst offender. Google's broad match got more aggressive in 2024 and then again in 2025. It now matches on "intent" rather than lexical overlap, which in practice means a keyword like buy running shoes matches queries like best walking shoes seniors because Google decided walking shoes are adjacent. The store pays, the click lands, the user bounces, and the line item sits in the account unnoticed.
Pull the search terms report for the last 90 days, sort by cost descending, and look at the top 50 queries. In a healthy account, the top 50 are all tightly related to the product and intent to buy. In an unhealthy account, you find at least 10 to 15 queries that are either informational ("how to clean running shoes"), unrelated ("shoes for flat feet" when you sell trail runners), or competitor brand terms you never intended to bid on. Each of those is a negative keyword you should have added six months ago.
The mechanic to fix this is not glamorous. It is a weekly 20-minute review of the search terms report, flagging queries with high cost and low or zero conversions, and adding them as negatives at the campaign or account level. Most stores never do this, which is why the same junk query keeps showing up every week and the store keeps paying for it. Broad match without a negative keyword discipline is the single largest source of Shopify Google Ads wasted spend in the audits we run. Not a close second. It is first by a lot.
Source 2: low Quality Score keywords
Quality Score is Google's 1 to 10 estimate of how relevant your ad and landing page are to a given keyword. See the Quality Score support doc for the official breakdown. It drives your CPC directly. A keyword at QS 10 might cost you $0.60 per click. The same keyword at QS 4 costs you $2.10. Same click, same user, triple the price, and the reason is that Google thinks your landing page does not match the search intent well enough.
Every Shopify account has a long tail of keywords at Quality Score 4 or below. Sometimes it is because the keyword is too broad for the landing page you sent it to (sending hiking gear to a specific trail shoe collection page). Sometimes it is because the ad copy does not contain the keyword. Sometimes the landing page is slow, missing the product, or showing a 404 because a URL got renamed and nobody updated the ad. Whatever the cause, a QS 4 keyword is a tax on your CPC that you can either fix or pause.
Best to run this sweep quarterly. Sort all keywords by Quality Score ascending, look at anything scoring 4 or below that has spent more than $200 in the last 90 days, and make a decision on each. Three options: (1) rewrite the ad and landing page to actually match the keyword, (2) move the keyword to a more relevant ad group where it naturally matches, (3) pause it and redirect budget to keywords at QS 7 and above. Option 3 is right more often than operators expect. Not every keyword is worth saving.
Source 3: PMax asset groups without product exclusions
Performance Max is where the biggest waste lives in most Shopify accounts, because PMax is a black box by default and the default settings push spend toward whatever converts easiest. Which is usually branded search. Which means your PMax campaign is quietly eating your brand traffic, reporting great ROAS (because branded traffic always has great ROAS), and starving your actual prospecting of budget. The campaign looks like it is working and is actively hurting the business.
The fix is two specific levers. First, add brand exclusions at the account level so PMax cannot bid on your own brand terms. This is configured under the account settings, not the campaign, which is why most operators miss it. Second, build a product exclusion list for products PMax should not promote. Low-margin SKUs, out-of-stock items, seasonal products outside their season, anything where ad spend against the product does not clear the margin. Most Shopify accounts we audit have zero product exclusions on PMax, which means every product in the feed is getting equal-weighted spend, including the loss leaders.
For google ads wasted spend ecommerce specifically, PMax leakage is the easiest thing to fix and the hardest to spot. Easy to fix because both levers take five minutes in the UI. Hard to spot because the campaign-level ROAS looks fine. You have to segment the data by product or by search term category to see the leak. See Google's Performance Max brand exclusions documentation for the exact setup path. One note, PMax brand exclusions only filter search queries, not display or YouTube placements, so the lever is narrower than it sounds. It still moves the number meaningfully.
Source 4: dayparting you never set
Dayparting is the scheduling control that tells Google when your ads are allowed to run. Most Shopify accounts have it set to "all day, every day" because nobody ever touched it after launch. For B2C impulse purchases that is usually fine. For anything with a considered purchase cycle, a higher AOV, or a customer base that mostly buys during waking hours in one timezone, running ads 24/7 bleeds budget into the hours when nobody is converting.
Pull a report of conversions by hour of day for the last 90 days. Most Shopify stores will find that 70 to 80% of revenue lands between 9 AM and 11 PM local time, and the remaining 20 to 30% is spread across the overnight hours at a much worse ROAS. The overnight spend is not generating proportional revenue, it is just running because Google is allowed to run it. Set a bid schedule that reduces bids 50% between 1 AM and 6 AM and you recover spend with almost no revenue impact.
Weekend behavior is worth checking too. Some stores peak on Sunday (lifestyle products, fitness, gifts) and some crater (B2B-adjacent, office supplies, anything that plugs into a workflow). If your Sunday ROAS is half your weekday ROAS and you have equal budget running, that is a tell. Pull the day-of-week report, look at the spread, and adjust bids accordingly. A 20% reduction on the weakest day usually pays for itself inside a week. This is one of the simplest ways to cut google ads cost shopify accounts run into, and almost no operator under $100k monthly spend ever does it.
Source 5: geographic leakage into ROAS-destroying regions
Location targeting is the last big leak and the one that takes the longest to diagnose. Most Shopify stores target either "United States" or "United States and Canada" at the campaign level and then never segment the report by region. Which is how you end up finding, three months in, that the account is spending 18% of budget on clicks from states where the ROAS is 0.3 because shipping costs eat the margin, the customer base is not there, or the creative does not resonate with that regional audience.
Pull a report of campaign performance by state (or province, or country if you are international) for the last 90 days. Sort by ROAS ascending. Any region spending more than $500 with a ROAS below 1.0 is a candidate for exclusion or bid reduction. Do not just cut it immediately. Check the data honestly. Sometimes low-ROAS regions are low because of a creative mismatch you can fix. More often they are low because the unit economics never worked there in the first place. Shopify ppc waste in geo targeting compounds because Google's auto-targeting drifts toward easier clicks, which often means lower-income or lower-intent regions, which often means worse ROAS.
One thing to watch. "Presence or interest" targeting is Google's default and it includes users who are not physically in your target region but have shown "interest" in it. That means if you target "California" you also get clicks from people Google thinks are interested in California, which could be anyone planning a vacation, researching a move, or who just searched something California-related once. Switch targeting to "Presence" only. Revenue almost never drops. Waste does.
The 30-day waste audit you can run yourself
This is the sequence we run on every new Shopify audit. Nothing fancy. No tools you do not already have. It takes about 3 hours spread across the month and typically surfaces 25 to 40% of spend that can be pulled back into accounts that actually convert. If you want an outside pair of eyes, our team runs this audit for free, the details are at the end of this page. Doing it yourself works too.
- Week 1: Pull the search terms report for the last 90 days. Add 30 to 50 new negative keywords. Commit to a weekly 20-minute review going forward.
- Week 2: Sort all keywords by Quality Score ascending. Flag everything at QS 4 or below with more than $200 in spend. Decide: rewrite, move, or pause.
- Week 3: Audit PMax. Add brand exclusions at the account level. Build a product exclusion list for any SKU with margin below 20%. Check the asset groups for creative relevance.
- Week 4: Pull the hour-of-day and day-of-week reports. Set a bid schedule. Pull the geo performance report. Exclude or reduce bids on any region below 1.0 ROAS with more than $500 spent.
The effect compounds. Cutting wasted spend does not just save the money you cut. It frees budget to flow into the keywords, placements, and audiences that were already performing, which means the profitable part of the account runs hotter and the whole ROAS curve lifts. Most stores see the blended account ROAS climb 30 to 50% inside 45 days of running this audit end to end. Not because the creative got better. Because Google is no longer allowed to spend your money on the parts of the auction that never worked.
Frequently asked questions
How much of my Google Ads budget is probably wasted right now?
What is the fastest source of waste to cut?
Will cutting wasted spend reduce my total revenue?
How often should I run a full waste audit?
Should I just pause PMax if I cannot get it under control?
Does this audit process work for Google Ads on non-Shopify stores?
Shopify Google Ads wasted spend is not a mystery line item on the dashboard. It is a predictable pattern that shows up the same way in almost every account, and the 30-day audit above surfaces it in a few hours of focused work. Best to pull the search terms report first, add the negatives, and let that single change settle for a week before touching anything else. The compounding effect of cleaner data flowing into the rest of the optimization stack is real, and it is the reason accounts that run this audit end to end usually see ROAS climb 30 to 50% inside 45 days without a budget change. If the audit surfaces two or more of the sources above, the fix is mechanical, not strategic. Most stores just never run the audit. The accounts that do, scale cleanly. The ones that do not, hit a ceiling and blame the creative.
Get a full X-ray of your ad account
Paste your Meta and Google Ads. See exactly where signal is leaking. Free. 60 seconds.