Why is my Shopify site slow and what actually fixes it
A Shopify slow site is almost always a diagnosis problem, not a fix problem. Every store we audit comes in with the same question, "why is the site suddenly slow," and every operator is already halfway down the wrong rabbit hole. Usually they are blaming Shopify's servers or the theme, when the real cause is 3 apps, 18 pixels, and a hero image nobody resized in 14 months. The fix part is easy once you know what broke. The diagnostic part is where 9 out of 10 stores waste a week. This guide walks through the 20-minute diagnostic that finds the real cause, so you spend the afternoon fixing the thing that actually matters instead of shotgunning "speed booster" apps that make it worse. Most stores find the top cause inside the first 10 minutes and ship the fix the same day.
- Run PageSpeed Insights, WebPageTest, and Shopify's analyzer together. One tool lies, three tools agree.
- Check the Coverage tab in DevTools before you touch anything. 3 apps usually account for 60% of the problem.
- Mobile field LCP is the metric that matters. Not the lab score on the dashboard.
- If the fix is not obvious after 20 minutes of diagnosis, the problem is Liquid, not JS.
How to tell how slow is "slow" on Shopify
Shopify slow site complaints start with a feeling. The homepage takes a beat too long. A customer emails. The owner types the URL on their phone and thinks, yeah, this is slow. But slow against what? That is the first question, and most operators never answer it cleanly before they start "fixing" things. Best to define the bar before you touch the theme.
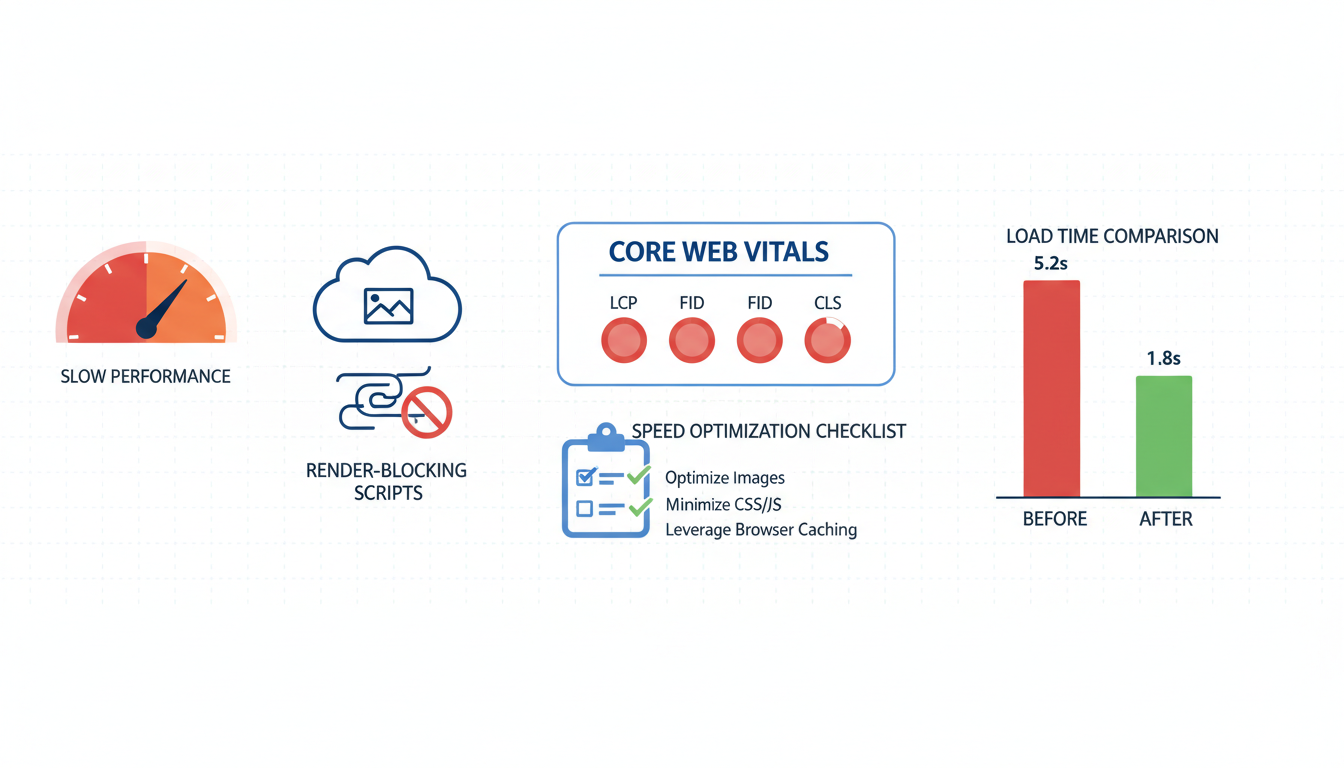
The honest numbers for 2026. Mobile LCP under 2.5s is Google's "Good" threshold and the bar that matters for Core Web Vitals. Between 2.5s and 4.0s is the "Needs Improvement" zone, where Google still indexes you but Quality Score and organic ranking both get dinged. Above 4.0s is "Poor," and that is where CR drops off a cliff because real humans on real phones start bouncing before the hero image renders. Most Shopify stores we audit sit between 3.2s and 4.7s on mobile, which means they feel slow, they test slow, and they are losing somewhere between 8 and 20 percent of paid clicks to bounce before the page even loads.
Desktop numbers lie. A store that scores 88 on desktop PageSpeed Insights can sit at 38 on mobile, and the dashboard composite score does not split them cleanly. So the owner sees a green "82" on the Shopify admin and assumes the store is fine, while 65% of traffic on mobile is bouncing at 4.2s LCP. The gap between desktop and mobile on Shopify is almost always the cause, not Shopify itself. The platform is fast. The accumulation of app JS and unoptimized images on top of it is what slows the phone down.
Best to anchor your diagnostic to two specific numbers before anything else. Field LCP on mobile (from the CrUX report inside PageSpeed Insights, not the lab score) and total JavaScript payload (from the Coverage tab in DevTools). If field LCP is above 2.5s and JS payload is above 1.2MB, you have a real problem and the cause is almost certainly in this guide. If field LCP is under 2.0s and you still feel like the site is slow, the problem is not technical, it is a design or UX perception issue, and no amount of speed work fixes that. Different problem, different playbook.
Running the diagnostic: PageSpeed Insights + WebPageTest + Shopify's own analyzer
A Shopify speed problem diagnosis needs three tools because each one tells you a different piece of the story and any single one in isolation misleads. The three we run on every audit, in this order.
- Google PageSpeed Insights. Open it, paste the URL, run the mobile test. Look at two things. The lab score at the top (that is the synthetic ceiling under perfect conditions) and the "Core Web Vitals Assessment" from field data below it (that is what real users experienced over the trailing 28 days). If the field LCP is more than 1s slower than the lab LCP, you have a real-world rendering problem that synthetic tests are missing. This is the single most common pattern we see on Shopify slow loading audits.
- WebPageTest. Same URL, select "Mobile 4G" from the location dropdown, run the test. The waterfall view is the money shot. You see every request in order, color-coded by type. Render-blocking scripts show up as red bars before the first content paint. Third-party pixels stack up in a cluster that pushes LCP past the fold. This is where you find the actual culprit, not the symptom.
- Shopify's "online store speed" report in admin. Go to Online Store, Themes, Actions, View Report. This one is worth running third because it gives you Shopify's own opinion of what is slow. Their composite score tends to be 10 to 15 points higher than real-world mobile PageSpeed, but the breakdown by section (apps, theme, images) is useful for cross-referencing the WebPageTest waterfall.
Run all three on the homepage, a top-traffic product page, and a collection page. Mobile only. Do not waste time on desktop tests during a diagnostic. The 65% of traffic that lands on mobile is where the actual problem lives, and desktop numbers are not going to surface the JS payload issue that usually causes Shopify page speed low scores.
The pattern to watch for. If PageSpeed Insights, WebPageTest, and Shopify's report all point at the same culprit (say, "large JavaScript payload"), that is your fix. If they disagree, the tools are doing their job right and you have multiple issues stacked on top of each other. Most Shopify stores in the "slow" bucket have two or three causes compounding, not one. That is why shotgunning "install a speed booster app" rarely works. The app fixes one cause and the other two remain, so the dashboard barely moves.
Cause 1: app bloat from the last 12 installations
App bloat is the cause in roughly 6 out of 10 Shopify slow site audits we run. The store installed a review app, an upsell tool, a chat widget, a wishlist, a currency converter, a back-in-stock notifier, a loyalty program, a popup tool, a quiz app, a free shipping bar, and an exit-intent modal over 12 months. Each one looked small at install. None of them disclose the render-blocking JS they inject. Now the homepage ships 2.4MB of JavaScript on first paint and nobody can trace it back to a single install.
The diagnostic that finds this in 5 minutes.
- Open Chrome DevTools on mobile emulation, hard-reload the homepage, open the Coverage tab. Sort by "unused bytes" descending. The top 3 rows are almost always third-party app scripts. Note the URL for each.
- Match each URL to a real app in your Shopify admin. Most look like
cdn.app-name.com/widget.jsorapp-name.shopifycdn.com/loader.js. Search the source name if you cannot match it by URL. - For each top-3 offender, ask: is it loading on every page or only where it matters? A wishlist that loads on the homepage but only gets used on product pages is the single most common Shopify slow loading offender. Most apps have a "load on selected pages" setting buried two menus deep. Turn it on.
- Uninstall anything that has not generated revenue or engagement in the last 90 days. The "we might use it later" tax is brutal. Most stores have 4 to 7 of these sitting in the admin doing nothing but blocking render.
The typical wins we see inside a single afternoon. A back-in-stock notifier that loaded on every page but was only needed on out-of-stock product pages. Saved 340KB and 0.6s of LCP. A currency converter loading synchronously in the head when it could defer. Saved 220KB and 0.4s. A loyalty widget loading on the homepage when it only mattered post-purchase. Saved 480KB and 0.9s. One store, all three, total LCP improvement 1.9s in one afternoon.
The trap worth flagging. Do not uninstall the Shopify Facebook and Instagram app or Google Tag Manager just because they show up in the Coverage report. Those are tracking infrastructure and killing them costs more than the LCP gain. Defer them instead. Most analytics scripts can move to defer or async without breaking the data layer, and that buys you most of the speed back without sacrificing attribution.
Cause 2: theme JavaScript that loads on every page
Theme JS is the cause in about 2 out of 10 Shopify speed problem audits. A developer added a carousel script six months ago. Then a currency toggle. Then a "recently viewed" widget. None of them got cleaned up when the next theme tweak shipped. Now every page carries every script, even pages that do not use most of them.
The smell test. Open layout/theme.liquid in the theme code editor. Search for <script>. Count the inline script tags and the external <script src= references. If the head has more than 4 or 5 scripts loading synchronously, you have theme JS bloat. Anything that is not the theme engine itself, the analytics pixel, or the cart drawer controller is a candidate for deferring or deleting.
The diagnostic pattern. Hard-reload the homepage with the Network tab open, filter by JS, sort by transfer size. Scripts larger than 50KB that are not from Shopify's own CDN or your F&I app are worth investigating. Click into each one, check the Initiator column. If it is loaded from theme.liquid and it is not critical above-the-fold rendering, it should either defer or move to the page where it actually runs.
The fix sequence that does not break design.
- Clone the live theme into a draft copy. Every change goes into the draft first. Rollback is one click.
- For each theme-level script, ask: does this run above the fold? Analytics, tracking, cart badges, chat widgets, popup scripts almost never do. Add
deferto those script tags. - For scripts that only run on specific templates (product recommendations on PDP, collection filters on collection pages), move them into the template file instead of
theme.liquid. They stop loading on the homepage, cart, checkout, and every other page where they do not run. - Screenshot the homepage, PDP, cart, and checkout before and after. If anything visual changed, you broke something. Find the offending change and try again. Most of these cleanups produce zero visible difference.
The broader playbook for this lives in the companion guide, Shopify Site Speed Optimization, which walks through the full theme code cleanup with the Liquid details. This section is the diagnostic half. Find the scripts, prove they are the problem, then reach for the playbook.
Cause 3: unoptimized hero images and fonts
Unoptimized media is the LCP element on maybe 4 out of 10 Shopify slow site audits, often stacked on top of app bloat. The hero image is usually the culprit. Someone uploaded a 4MB PNG as the homepage banner in 2023 and nobody has touched it since. The Shopify CDN serves the file at full size to every device, including phones on slow 4G.
The diagnostic that finds this in 2 minutes. Open PageSpeed Insights on mobile, scroll to the "Largest Contentful Paint element" section. It tells you exactly which element is the LCP and how long it took to render. If it is an image and the time is above 2.0s, the image is your problem. Right-click the image on the live site, open in a new tab, check the file size in the URL or the network tab. Anything above 200KB for a hero is oversized. Anything above 500KB is a disaster.
The four fixes that ship in 30 minutes.
- Append
&format=webpto the image URL in the section Liquid. Forces the Shopify CDN to serve WebP to browsers that support it, roughly 96% of traffic in 2026. Cuts weight 25 to 35% with no visible quality loss. - Set a
widthparameter that matches the display size. A hero shown at 800px wide on mobile should not download a 3200px source. Shopify Liquid supportsimage_url: width: 800. Combined withsrcset, serves the right size to every device class. - Add
fetchpriority="high"to the LCP image tag. Tells the browser to prioritize that image over everything else on the page. Drops LCP by 0.2 to 0.5s on most stores. - Remove
loading="lazy"from the LCP image. The mistake stores make is lazy-loading the hero because "lazy is always good." It is not good for the element that defines LCP. That element should load eagerly.
Fonts are the quieter half of this. If you use a custom brand font loaded from Google Fonts or Adobe Fonts, it adds a DNS lookup, SSL handshake, and an external request that blocks paint. Self-hosting the font in assets/ cuts 200 to 400ms. Adding font-display: swap stops the invisible-text flash that makes pages feel broken. These two changes ship in 20 minutes and nobody on the design team notices the difference because the visual font is the same, it just arrives faster.
Cause 4: third-party pixel scripts (the 15-20 you forgot)
Pixel sprawl is the silent killer on Shopify page speed low audits, especially on stores between 1 and 3 years old. Meta pixel. TikTok pixel. Pinterest tag. LinkedIn Insight tag. Criteo. Klaviyo onsite. Google Ads remarketing. GA4. Microsoft Clarity. Hotjar. Triple Whale. Northbeam. Plus whatever the last "tracking specialist" added and never documented. Some stores we audit have 18 to 22 tracking scripts loading on every page, and the owner knows about maybe 6 of them.
The diagnostic that finds every one.
- Open the live site homepage, open DevTools, open the Network tab, filter by "Doc," clear, hard-reload. Switch the filter to "JS" once it loads.
- Scan every script that loaded from a domain that is not yours, not Shopify's CDN, and not your core apps. Common pixel domains:
connect.facebook.net,analytics.tiktok.com,ct.pinterest.com,snap.licdn.com,static.criteo.net,static.klaviyo.com,googletagmanager.com,clarity.ms,static.hotjar.com,triplewhale.com. - Count them. Anything above 6 is pixel sprawl. Anything above 10 is a problem. Anything above 15 and the tracking layer alone is costing you 0.8 to 1.5s of LCP.
- For each one, ask: is this actively used? Meaning, is someone running a TikTok campaign right now, or did the store run one 14 months ago and the pixel never came out? The "we might use it later" tax shows up here too, and it is usually the worst on pixels because nobody wants to be the person who killed a tracking tag.
The fix is boring but effective. Route everything through a single GTM container (browser or server-side). Turn off pixels that have not seen a live campaign in 90 days. For pixels that are active but not critical above-the-fold, add defer so they do not block paint. This alone has dropped LCP by 0.6 to 1.2s on every store we have done the exercise on.
The related guide on pixel sanitization lives at Shopify Meta Pixel Duplicate Events for the dedup side of this. If you are running Meta CAPI, pixel sprawl compounds the problem because now the duplicates are not just browser-side, they are fighting the server-side CAPI events too.
Cause 5: Liquid loops and queries that block render
Liquid loops are the cause that stumps operators because it does not show up in any of the usual places. PageSpeed Insights does not surface it clearly. The Coverage tab is silent. DevTools shows a slow TTFB and nothing else obvious. This is the 1 in 10 cause where the symptom is "the page is slow and nothing in JS or images explains it."
The tell. TTFB (Time to First Byte) above 800ms on the homepage or collection page. Shopify's edge network should return the first byte in 150 to 400ms under normal load. If you see 1.2s+ on a consistent basis, the page is waiting on server-side Liquid to finish rendering before the HTML ships. That is almost always a loop or a nested query doing more work than it should.
Where the problem usually lives.
- Featured collections on the homepage that loop through all products instead of a fixed limit. A store with 2,000 products and a "Latest Arrivals" section that does
{% for product in collection.products %}without alimitfilter will loop through 2,000 products every single request. Addinglimit: 8drops TTFB from 1.4s to 300ms on the stores we have seen this on. - Recently viewed widgets that call a JSON endpoint for every product in a list. Old themes often fetch related products one at a time, in a loop. Modern Dawn-based themes do this server-side in a single call. The migration is 20 minutes of Liquid rework.
- Metafield lookups inside product card loops. If the product card on the collection page calls
product.metafields.custom.badgeand the collection has 40 products, that is 40 metafield lookups per page load. Cache the lookup at the top of the template or use a section-level setting instead. - Complex
ifblocks that re-evaluate inside loops. A common pattern is checking customer tags or cart contents inside every iteration of a product loop. Each check adds 5 to 15ms. Across 40 products that is half a second of TTFB you did not need to pay.
The diagnostic sequence. Open the slow page. Check TTFB in the Network tab under the initial document request. If it is above 800ms, open the theme code, find the template file for that page, search for {% for %} loops without a limit filter. That is usually the fix. For everything else, Shopify's Liquid performance documentation walks through the profiler tool that shows exactly which Liquid code is eating the render time.
This cause is rare enough that you should check the first four before diving here. But when it is the cause, it is the only cause. Fixing apps and images on a store that is bleeding 900ms of TTFB to a runaway Liquid loop does not move the needle. The browser never gets the HTML fast enough for any of the other fixes to matter.
Frequently asked questions
Why does my Shopify site feel slow even though the dashboard says 82?
How do I know if apps are slowing my Shopify site?
Does Shopify's server cause slow loading or is it always the theme?
Will a Shopify speed booster app fix my slow site?
How long before speed fixes show up in conversion rate and revenue?
Is my Shopify theme or my apps the bigger cause of slow loading?
theme.js or internal scripts from your own theme, theme code is the cause. If JS payload is under 1MB but LCP is still above 2.5s, the cause is the hero image or the custom font loading pattern. The 20-minute diagnostic in this guide tells you which of the three buckets you are in inside the first 10 minutes, and that is usually enough to start shipping the fix the same afternoon.A Shopify slow site problem is almost always fixable, and usually in an afternoon, once you know which of the five causes is actually the cause. Most stores skip the diagnostic and jump straight to "install a speed app," which fixes the wrong thing, or to "rebuild the theme," which is 6 months of work for something a Coverage tab scan would have surfaced in 5 minutes. Best to run the 20-minute diagnostic in this guide before you touch a single file. PageSpeed Insights on mobile, WebPageTest waterfall, Shopify's own report, then the Coverage tab to find the top 3 offenders. If the top 3 are apps, you fix apps. If the top 3 are theme scripts, you defer or move them. If the TTFB is above 800ms, you go hunting for the Liquid loop. In that order. The broader playbook for each fix lives in the companion guide. This one was about finding the right cause so you stop fixing the wrong thing.
Get a full X-ray of your ad account
Paste your Meta and Google Ads. See exactly where signal is leaking. Free. 60 seconds.