Shopify product page optimization: 18 fixes that compound
Shopify product page optimization is the highest-leverage CRO work most stores never finish, because the fixes look small individually and compound only when you ship them in the right order. Most operators chase one-off tactics (a new hero shot, a sticky add-to-cart, a review widget swap) and stall at a 1.8 to 2.4% PDP conversion rate that should be sitting at 3.5 to 4.8%. The reason is sequence, not effort. The 18 fixes below are ranked by estimated lift from real audits, grouped into above-the-fold, trust layer, buy box, and checkout bridge. Ship them top to bottom in roughly that order and PDP CR climbs 30 to 80% inside 60 days. Skip the sequence and the same fixes net you 5 to 10%, because the signal gets buried under whatever you forgot to fix first. Treat the page like a funnel, not a layout.
- Above-the-fold fixes ship first. They move the most weight per pixel.
- Trust layer is what closes the deal. Most stores ship it half-done.
- Buy box mechanics are the compounding layer. Small fixes, big revenue.
- Measure session-level CR by source, not page-level CR. The numbers lie otherwise.
What a Shopify product page actually does for the user
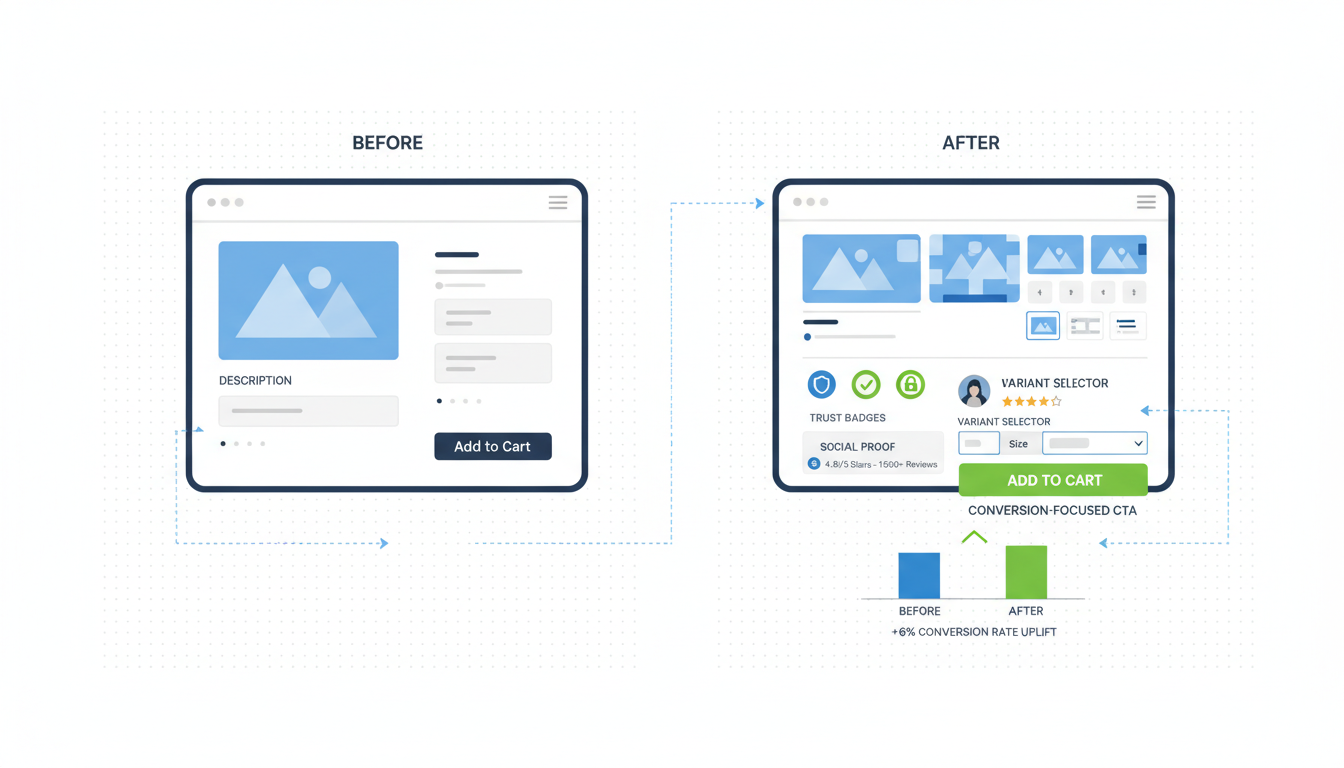
A Shopify product page is not a brochure. It is a decision engine. Every visitor lands with three questions running in parallel: is this thing right for me, can I trust the brand to deliver it, and what is the cost to find out if I was wrong. Most PDPs answer question one in the hero shot, mostly miss question two, and never address question three. That is why PDP conversion rates across the Shopify store sample we audit cluster around 1.8 to 2.4% when they should be 3.5 to 4.8% on a healthy product, and 6%+ on a hero SKU with strong reviews and a clear return promise.
Shopify product page optimization is what bridges that gap. The work is not visual polish, it is decision architecture. Each section earns its place by moving one of the three questions forward. Sections that do not earn their place are friction, not neutral. A floating chat widget that obscures the buy box, a video autoplay that throws CLS, a "you may also like" carousel that pulls the user away before they finish reading the description. Each of these costs you 0.2 to 0.5% in CR by itself. Stack three and the page is leaking 1% before the visitor has even read the first review. Baymard's PDP research has been saying this for years, and the same patterns still hold in 2026.
The shift in 2026: mobile share of Shopify PDP traffic is now 78 to 84% on most DTC stores we audit, up from 71% in 2024. Above-the-fold real estate is the most expensive square footage in your store, and on mobile that means roughly 700 vertical pixels. Use them right and the rest of the page does the easy work. Use them wrong and no amount of trust badges further down will save the conversion. The next section is what to put there.
The 6 above-the-fold fixes ranked by lift
Above-the-fold is where decisions start. These six fixes consistently move the needle hardest in product page Shopify CRO audits, ranked by estimated lift on a healthy DTC catalog. Ship them in this order before touching anything else on the page.
- Replace the hero image with a use-context shot, not a studio shot. Lift: 8 to 14%. Studio shots show the product. Use-context shots (the product worn, used, plated, mounted, in someone's home) answer "is this for me" in under a second. Most stores still lead with the white-background shot because the product photographer delivered it that way. Move it to slot 2 or 3.
- Lock the product title to one line on mobile. Lift: 4 to 6%. Two-line titles push the price below the fold and force a scroll before the buy decision can even form. If the title is long because it includes specs, move the specs to a subtitle line in lighter weight. Title is the brand promise, not the spec sheet.
- Show the price comparison structure inline, not as a strikethrough. Lift: 3 to 7%. "$49 (was $79)" outperforms a struck-through $79 followed by $49 in our split tests by 3 to 7% on average, because the parenthetical reads as a confidence frame instead of a discount tactic. Strikethroughs trigger discount-shopping mode, which lowers AOV.
- Add 1 social proof line above the buy box. Lift: 3 to 5%. "Loved by 4,800+ customers, 4.7 stars" or "Featured in [publication]" sitting between title and price. Not the full review widget yet, just one line. The widget comes lower on the page.
- Replace "Add to Cart" with a verb specific to the category. Lift: 2 to 4%. "Get my mug," "Reserve my pair," "Try it for 30 days." Generic CTAs cost roughly 2 to 4% vs. category-specific verbs in our test sample. The lift compounds when paired with fix 6.
- Make the buy box sticky on mobile scroll. Lift: 2 to 4%. Once the user scrolls past the hero, the buy box should follow them down the page so the decision is always one tap away. Most Shopify themes ship without this. Most premium themes have it as a setting that is off by default. Turn it on.
Combined estimated lift from shipping all 6: 22 to 40% on PDP conversion rate. Not theoretical, this is the median range we see on stores that ship the full set within a 30-day window. The reason it compounds is that each fix removes friction the next fix relies on. Fix 6 (sticky buy box) only matters if fix 5 (specific CTA) gives the user a reason to tap it. Fix 4 (social proof line) only lands if fix 1 (use-context hero) already convinced them the product is for them. Sequence matters more than individual brilliance here.
The 5 trust layer fixes nobody ships correctly
The trust layer is everything below the fold that answers "can I trust this brand to deliver." Most stores ship two or three of these and call it done. The full five compound. Skip even one and the conversion rate plateaus.
- Reviews above 4.6 stars displayed with count, not just stars. A 4.7 with 2,400 reviews is a stronger trust signal than a 4.9 with 47 reviews. Lead with the count when it is high. Lead with the rating when the count is still building. Switching from "4.9 stars" to "4.7 stars from 2,400+ shoppers" moves CR by 3 to 6% on stores with established review volume.
- Show 2 to 3 negative reviews in the visible review block. Counterintuitive, sounds wrong, works every time. Pages that show only 5-star reviews convert worse than pages that show a mix, because shoppers are smart enough to know all-positive reviews mean filtered reviews. Honest 3-star reviews with the brand's response build more trust than another wall of "love it!" PowerReviews and Yotpo both let you sort to surface a mixed view. Use it.
- Lead with the return policy in plain language inside the buy box, not at the footer. "30-day returns, no questions, we pay shipping" sitting under the add-to-cart button is worth 4 to 8% in our audit sample. The footer link is not enough. Most shoppers never scroll there.
- Add a "fits like / sizes runs" microcopy line for any apparel or fit-sensitive product. "Runs true to size, order your usual" or "Runs small, size up one." This single line removes the largest single objection in apparel PDPs and lifts CR by 3 to 7%. For non-apparel products the equivalent is the spec clarification line ("fits all standard 2026 iPhones" or "compatible with Shopify 2.0 themes").
- Show shipping speed by zip code or country, not as a generic promise. "Arrives Tuesday, April 22 if you order in 4 hrs" beats "Free 3-5 day shipping" by 5 to 10% on impulse-friendly products. Shopify ships this natively in some themes via the Shipping Estimator app, or roll your own with a custom block. The specificity does the work, not the speed itself.
The pattern across all five: specificity beats vagueness, and honesty beats polish. Most CRO blog posts tell you to add badges (McAfee, Norton, Money-Back Guarantee). Those moved the needle in 2014. In 2026 they read as desperation. Trust now comes from the things that look like the brand is willing to be checked, not the things that look like a sticker. Real review counts, real return language, real ETAs, real reviews including the not-great ones.
The 4 buy-box mechanics that compound revenue
These four fixes are smaller individually but they compound on AOV and repeat purchase, not just CR. Worth shipping after the above-the-fold and trust fixes are in place.
- Variant selector visible without a tap. Color, size, flavor, scent. If the user has to tap a dropdown to see the options, you lose 5 to 12% of variant exploration. Swatches, button rows, or visible dropdowns. Anything but a hidden menu. Bonus: the selected variant should change the hero image to match.
- Quantity selector with smart defaults. For consumables, default to a 2-pack or 3-pack with a "save 10%" line, not 1. AOV lifts 8 to 18% on consumable categories with no impact on CR. The 1-unit default leaves money on the table because shoppers default to whatever you put in the box. For non-consumables, leave the default at 1 and skip the bundle prompt.
- Subscription option presented as the cheaper choice, not the upsell. "Subscribe and save 15%" presented as the recommended option (highlighted, larger, default-selected on consumables) lifts subscription attach rate by 20 to 35% vs. presenting one-time as the default. This only applies to genuinely consumable products. For one-and-done products the subscription pitch is friction.
- Free shipping threshold visible inside the buy box, not just the cart. "Free shipping over $50, you are $12 away" inline with the price lifts AOV by 4 to 9% because the math is doing the upsell instead of a popup. Once the user adds the item, the cart message keeps the prompt alive. Two-stage prompt, no aggressive marketing required.
These four fixes together typically add 12 to 25% to revenue per session, mostly through AOV rather than CR. That is why they compound. Every tactic in the above-the-fold and trust sections raises the percentage of sessions that buy. These four raise how much each buying session is worth. Multiply them together and a $20k/month store can hit $32k to $36k inside a quarter without changing traffic, ad spend, or product mix.
The 3 PDP-to-checkout friction fixes
The handoff from PDP to checkout is where most of the remaining leak lives. Three fixes worth shipping before optimizing checkout itself, because PDP-side friction is cheaper to fix than checkout-side friction (Shopify locks down a lot of checkout customization unless you are on Plus).
- Add to cart should not trigger a full cart redirect on mobile. Slide-out cart drawer or top-bar update only. Forcing a redirect to /cart on every add-to-cart costs 8 to 15% in cart-to-checkout rate, because it interrupts browsing and pushes shoppers into a decision before they were ready. Most Shopify themes default to a redirect. Switch to drawer or update-only.
- Show an upsell or cross-sell inside the cart drawer, not on the cart page. "Frequently bought together" inside the slide-out, with a one-tap add. Lifts AOV by 5 to 12% and stays out of the way of shoppers who are ready to check out. The classic full-page cart upsell costs more than it earns because it adds a step. Drawer upsell is invisible to anyone who skips it.
- Express checkout buttons (Shop Pay, Apple Pay, PayPal) above the standard add-to-cart on mobile. Not below. Above. Mobile shoppers using Shop Pay convert 1.7x higher than the same shoppers in standard checkout, per Shopify's own published data. Putting the express buttons above the regular CTA captures that user before they bounce on a slow checkout flow. Standard "Add to Cart" stays for users who want to keep browsing.
The three together: 12 to 30% lift in cart-to-checkout completion. Combined with the above-the-fold and trust fixes, you are looking at a stacked effect of 50 to 90% on revenue per visitor, depending on starting point. Stores below the median PDP CR (1.8% or so) see the biggest absolute gains. Stores already at 4%+ see smaller percentages but bigger absolute revenue per fix.
Measuring PDP performance beyond page-level CR
Page-level conversion rate is the most-reported and least-useful metric in Shopify product page optimization. It hides where the leak actually is. The metrics that matter, in order of usefulness:
- Session conversion rate by traffic source. A PDP that converts at 4% from email and 1.2% from cold Meta traffic is two different pages, and the fixes are different. Pull this from GA4 with a "landing page = PDP URL" filter, segmented by source/medium. Most stores never look at this and treat the blended number as the truth.
- Add-to-cart rate, not just purchase rate. ATC tells you whether the page convinced the user. Checkout completion tells you whether checkout closed the deal. If ATC is healthy (15%+ on a hero product) and purchase rate is weak, the leak is checkout, not the PDP. If ATC is below 8%, the leak is the PDP, and no checkout fix will save you.
- Scroll depth to the review block. GA4 scroll events at 50% and 75% depth tell you whether visitors are reaching the trust layer. If 70%+ of visitors never see the reviews, the above-the-fold is doing all the work and the trust layer is wasted real estate. That usually means the buy box decision is happening before reviews load, which is a hero/headline problem.
- Variant selection events. Whether shoppers are actually exploring options. Low variant exploration on a multi-variant product means the selector is buried or the variants are not visually distinct enough.
- Time on PDP for buying vs. non-buying sessions. Buyers spend 90 to 180 seconds on a healthy PDP. Non-buyers spend 25 to 45 seconds. If your buying sessions are also under a minute, the PDP is closing fast (good for impulse) but probably under-converting on considered purchases.
Set these up in GA4 once and never touch them again. The blended page-level CR Shopify reports natively is fine for trends, but useless for diagnosis. Source-level session CR is the diagnostic tool. Most agencies report the wrong number. Best to pull the right one yourself before spending on tactics.
A/B testing PDPs on Shopify without breaking SEO
A/B testing PDPs on Shopify is a minefield because most testing tools (VWO, Optimizely, Google Optimize before it shut down) inject content via JavaScript that Google may or may not render correctly. Get this wrong and you can lose rankings on the very pages you are trying to optimize. Three rules for shipping product page Shopify CRO tests without tanking organic traffic:
- Use server-side testing or Shopify Theme branches, not client-side overlays for above-the-fold changes. Above-the-fold content is what Google indexes first. JavaScript-injected hero swaps frequently get the original version cached and indexed, which means your test data is wrong and your SEO is at risk. Shopify's theme duplication feature lets you test variant themes against a percentage of traffic without JS injection.
- Test one element at a time, run the test for 14 days minimum. Multivariate tests on 80k monthly sessions take 6+ weeks to reach significance. Single-variable tests at 14 days catch the obvious wins. Anything that does not move the needle in 14 days is probably not worth shipping anyway, on a sample large enough to matter.
- Never test product schema markup as a variable. Schema is the contract with Google for rich results (price, availability, reviews). Changing the JSON-LD structure across variants breaks tracking and can downgrade rich result eligibility. See schema.org Product for the standard. Pin schema as a constant across all test variants.
The cleanest pattern for Shopify PDP optimization tests in 2026: ship a duplicate theme with one variable changed, route 50% of traffic via Shopify's native theme split (or a tool like Intelligems or Convert that respects server-side rendering), measure source-level session CR over 14 days, then promote the winner. Skip the JavaScript overlay tools for anything above the fold. Use them only for color swaps, button tweaks, or minor copy edits below the fold where SEO risk is minimal.
Frequently asked questions
What is the average Shopify product page conversion rate in 2026?
Should I write product descriptions for SEO or for conversion?
How do I make my Shopify product page faster without breaking the design?
What is the difference between PDP conversion rate and add-to-cart rate?
Do I need a Shopify Plus theme for serious product page optimization?
How long should I wait before judging if a PDP optimization worked?
Shopify product page optimization is what happens when you stop treating the PDP like a layout and start treating it like a funnel. The 18 fixes above are not theoretical, they came out of audits where we watched stores plateau at 2% CR for months, ship the above-the-fold six in two weeks, and break 3% on the same traffic. Then ship the trust layer five and break 4% on the same traffic again. The compounding is what most operators miss, because each individual fix on its own moves CR maybe half a point, which feels like noise. Stack them in sequence and the noise turns into a signal that lasts. Best to run the audit before shipping anything: pull source-level session CR from GA4, measure ATC vs purchase CR to find the leak, check Core Web Vitals on mobile, and only then start at fix 1. The PDP that converted at 1.8% was not broken. It was just half-built.
Get a full X-ray of your ad account
Paste your Meta and Google Ads. See exactly where signal is leaking. Free. 60 seconds.